

The February employment report was weaker and/or more dovish than expected along every dimension, except the change of employment on the month, which was more than fully offset by revisions in the back data, which may harden expectations of more to come there. Some of this can be attributed to the fact that the consensus was oddly “hot.” For example, the screen consensus presumed that the storm distortion on hours worked in January would fully reverse in February, while the effect on wages would barely.
However, there were some more substantial misses as well. And my own interpretation is that they create some novel uncertainty in the outlook that steers me, at least, away from wanting to reset a short view in rates. I have my priors but for now would want to limit the risk of being blinded by them. The following three items particularly catch my attention.
First, the rise of the unemployment rate took it to a level that would signal a recession having started on conventional rules – if the unemployment rate were to remain at that level for the next three months, because the rules cue off the 3-month moving average. These rules are obviously data mined, which should give us pause about their reliability in real time application. (See also: yield curve.) But they are reinforced to some extent by a weakness in growth of the index of aggregate hours. An offset is that private employment is rising at a rate that is clearly inconsistent with nearby recession risks. I would put the most weight on that, within a recession discussion. But this is slightly less a slam dunk than it was.
If the unemployment rate were unchanged from its February level in next two months
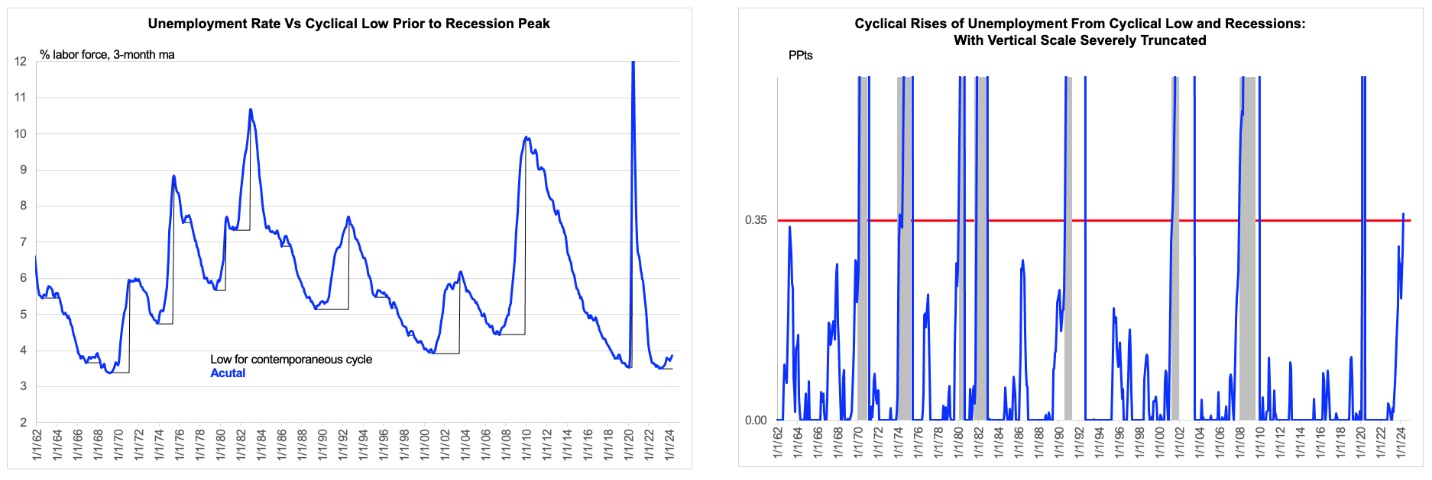
Data are actual to February and simulated to April. Breaching the red line is meant to be associated with recession, but these rules are all inevitably data mined.
Second, the research series within the household survey was down a lot, even after (my own) adjustment (to last month’s growth) for new population controls in the January data. The gap between the 3-month rate of growth of the research series and that of headline employment is now easily the widest since the Covid shock, as you can see by glancing at the chart below. And perhaps more to the point, the research series has shown zero growth over the past eight months. For measuring monthly employment change, we should place much more weight on the headline data from the establishment survey. But the cumulative weakness in the household survey data is puzzling, particularly relative to my own priors.
We all know the establishment survey is more reliable month to month

Data are actual to February
The third issue here does not go to potential weakness in real growth but represents a moderate change in a dovish direction from what we might have thought a month ago. The two charts below contrast my measures of headline and mix-shift-controlled wage growth as they appeared in the January data and then in the February data. We might have expected a weaker print in February to offset the obvious distortion in January, and that is why I would describe this change as moderate, rather than alarming (to the hawks). Even with the miss and revisions, it still looks as though wage growth has stabilized, at a pace that should be too strong for the taste of the Fed. But the earlier data had hinted at something quite a bit hotter, even – to some extent – if we faded it for the technical distortions. This does not throw the debate to the doves by any means, but it steals what might have been an ace from the hawks.
How the obviously distorted wage data looked last month
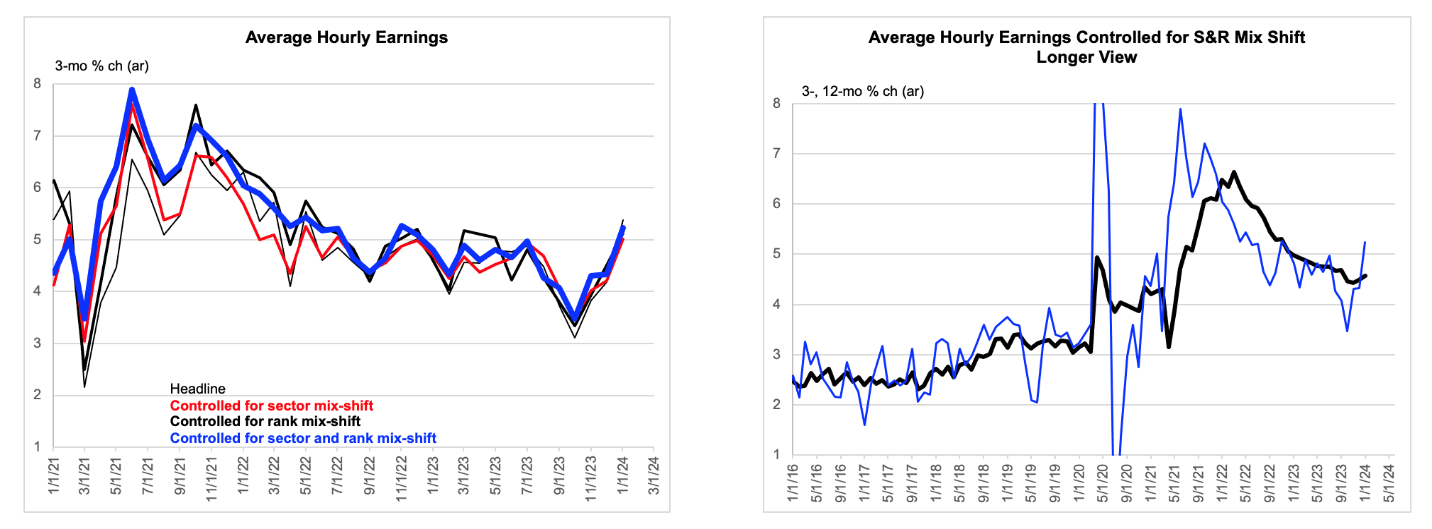
Data are actual to January and January vintage.
How the less distorted wage data look now
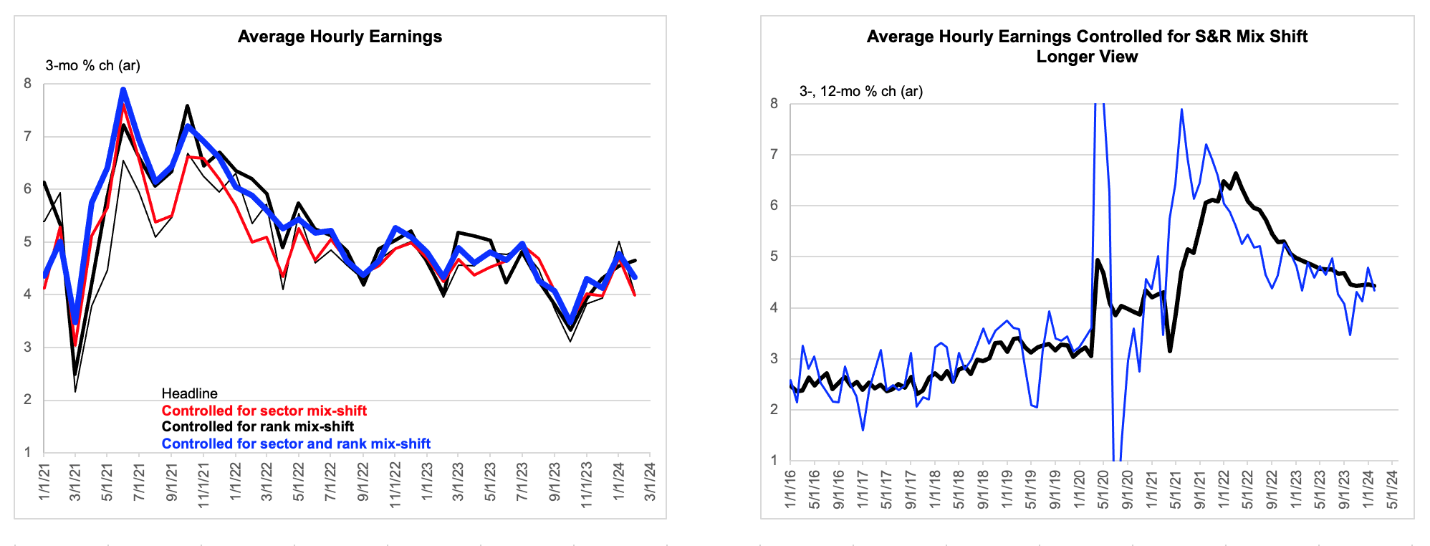
Data are actual to February incorporating January revisions.
One risk the hawk might take here by staying chickened out is that the CPI prints strong. A second bit of bad news there would have a disproportionate impact, for the obvious reason. We shall see — and slice the data carefully when they come.

