

Bloomberg’s WIRP function suggests that, abstracting from term premia, the mean of the probability distribution has the Fed cutting the funds rate just over 3 times (assuming 25 bps a pop) during 2024. On this basis, we might say that the market is still slightly ahead of the Fed. Of course, the Fed is not guiding, but you know what I mean.
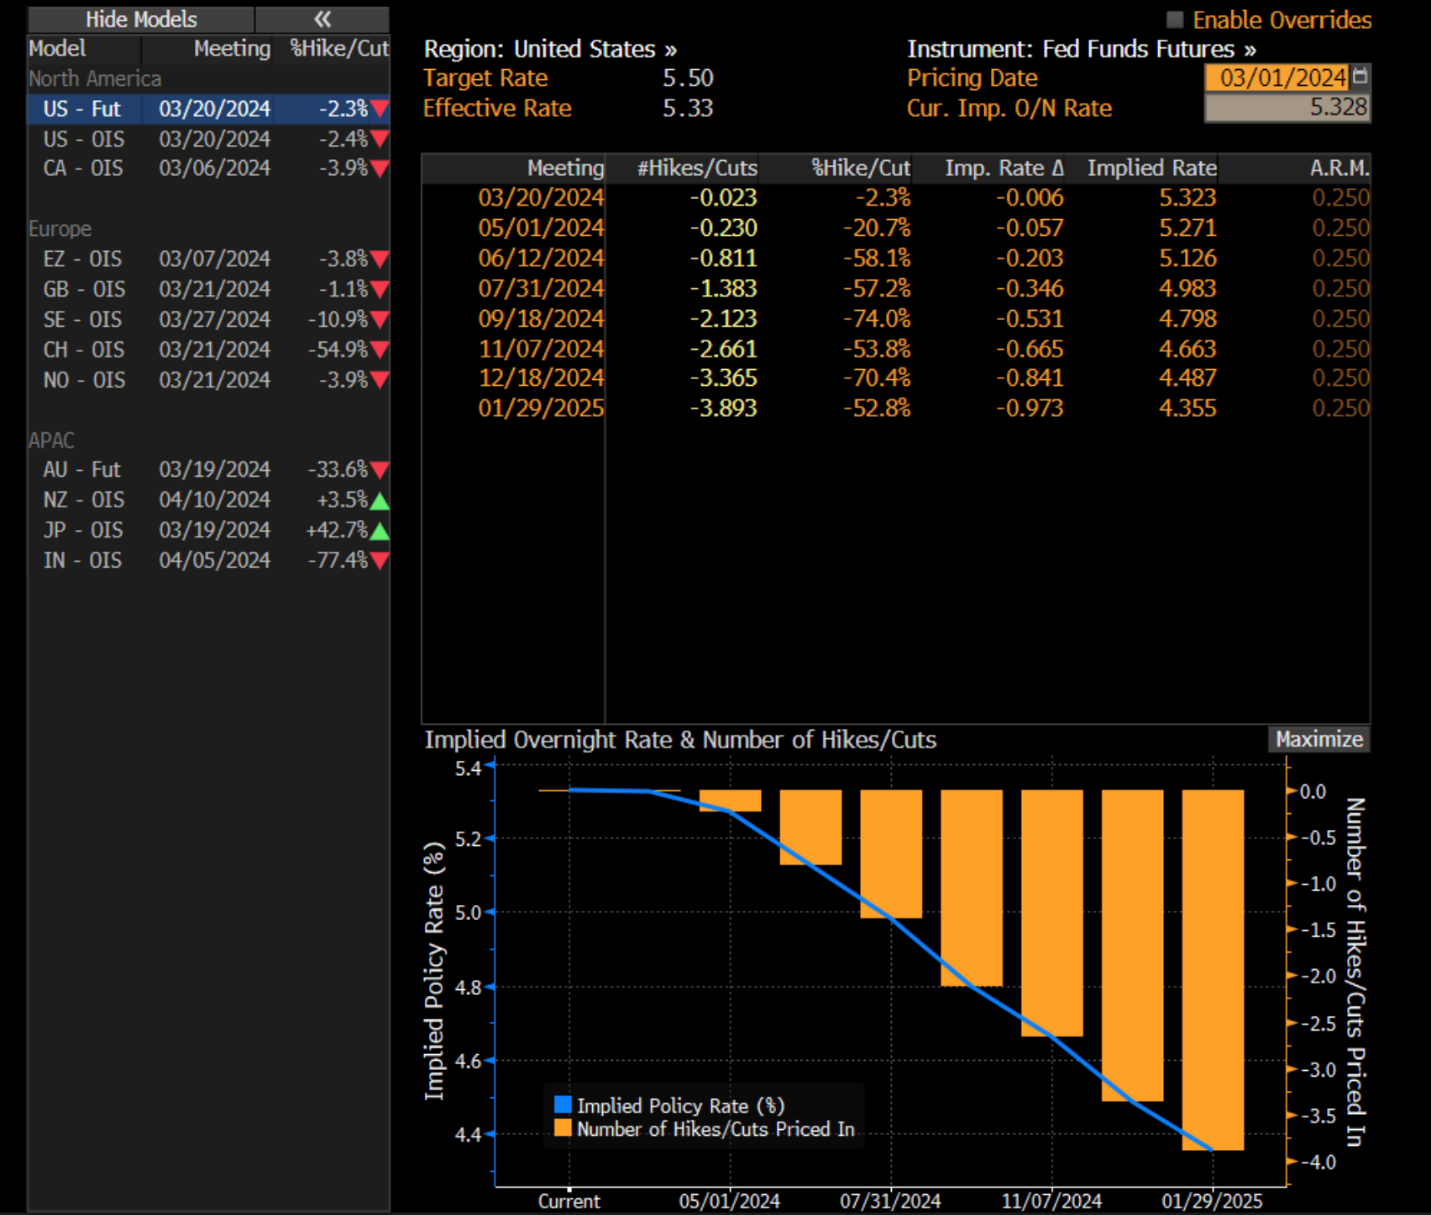
The problem with the WIRP function, though, is that it traces out the mean of the probability distribution, not the mode, again abstracting from term premia. But what the Fed writes down in its dot plot and talks about in speeches relates to the modal views among FOMC participants. So, to do an apples to apples comparison, we might want some proxy of what the market prices as the mode. Because the skew in rates is to the left, we have reason to suspect that the mode is higher than the mean and therefore “prices” less rate cutting.
This evening I have been familiarizing myself with that Bloomberg function that allows us to trace out the entire probability distribution for the priced funds path, which relies on options, not just futures. That function cannot identify the mode per se, and what is being forward priced is the 3-month SOFR rate, rather than the funds rate at specific Fed dates. Still, we can get a good sense. For example, the gap between the SOFR rate and the 50th percentile of the distribution is about 20 bps in late 2024. The table under the attached chart below implies a slightly narrower spread, but that is because it is comparing one figure for the beginning of December and another figure for the end. If we do apple to apples time wise, the gap is about 20 basis points. Indeed, the SOFR futures strip runs entirely below the 40th percentile of the distribution implied by options prices. If I had to guess, I would say the 35th percentile overlaps with the mean, implying leftward skew.
If we brazenly take the 50th percentile, i.e., median, to be what the market considers as most likely, i.e., mode, then we need to add about 20 bps to the central rate in WIRP function for the end of the year. And that would map to fewer than 3 funds rate cuts by the end of the year as the priced modal case. (Incidentally, ignore the distinction between Feb 29 and March 1 pricing. The Feb 29 is apparently the close and what they call March 1 is roughly live. I think.)

I like the idea of using Bloomberg data because many clients can follow along by using the same utility, which is quite flexible. Just follow the instructions I sent out earlier today. Also, Bloomberg does not impose the same long reporting lag that we find with the Atlanta Fed utility. My problem is that I cannot actually vouch for the numeracy of the Bloomberg analysts. I assume it is high, but this is not my area. Having said that, this does fit with my suspicion that the mode is to the right of the mean and that markets may actually now have a central case (i.e. mode) that is no more dovish than what the Fed is suggesting. I am happy to be corrected by folks closer to these issues. But I thought this was somewhat interesting.
I think the barrage of seemingly coordinated hawkish Fed rhetoric over the past couple weeks has helped to deliver this view, rather than, say, markets coming to my sense of the economics involved here. At the margin, that would weaken the case for being short rates here, if true. But it is not something I can prove.
As an aside, I would mention that I learned of this utility from Bloomberg’s David Wilcox who wrote an opinion piece leaning into the view that the Fed might actually hike rates. The 90th percentile actually slopes up from here, he noted. But my interpretation is the opposite of his. The skew is clearly to the left, not the right, as not even the 80th percentile slopes up. So, I believe the more relevant point is the one I emphasize. The market may have got slightly to the hawkish side of the Fed as the mode.
Comments most welcome. I am new to all this.

