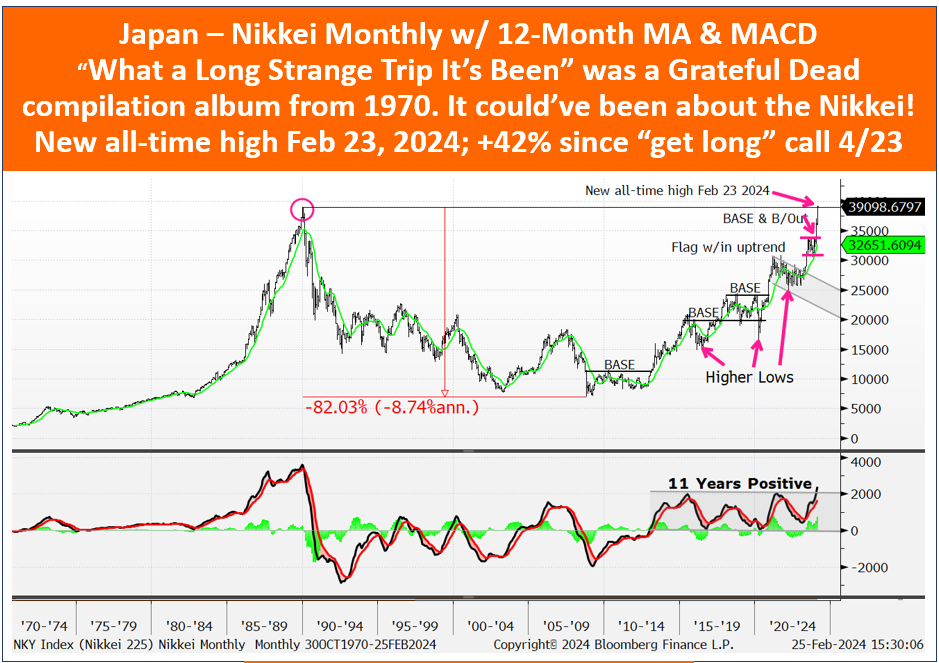
1 The Nikkei moved to a new all-time high last week?
2 The Nikkei is +17% in 2023 in ¥, is +9 ½% in US$, and is the best performing big market in 2023 in ¥ or in US$?
3 The Nikkei (incl. 2023) is up in 11 of the last 13 years and is +362% over that time?
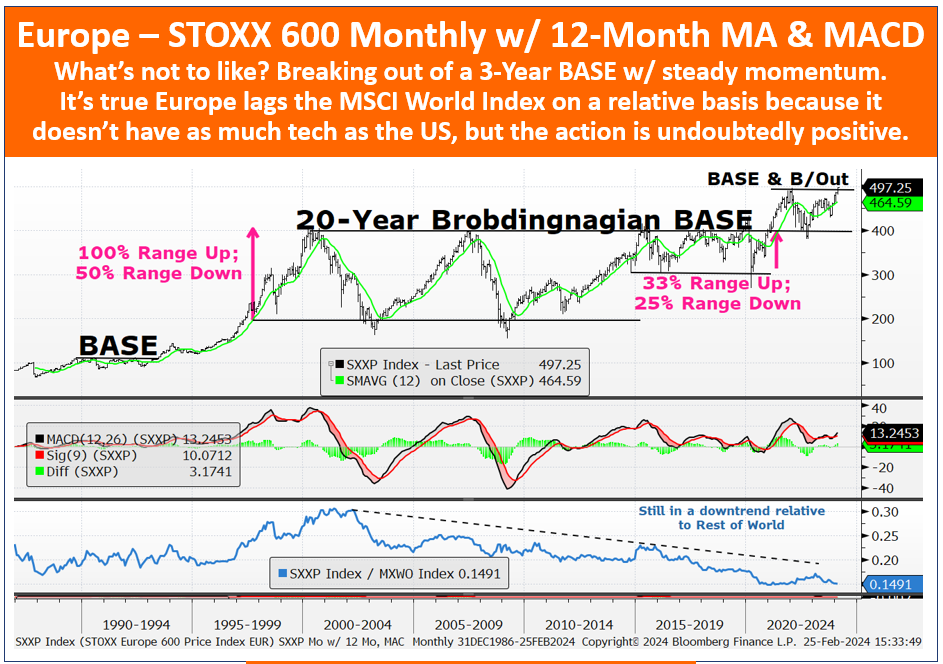
4 The STOXX 600 Europe Index is at a new all-time high?
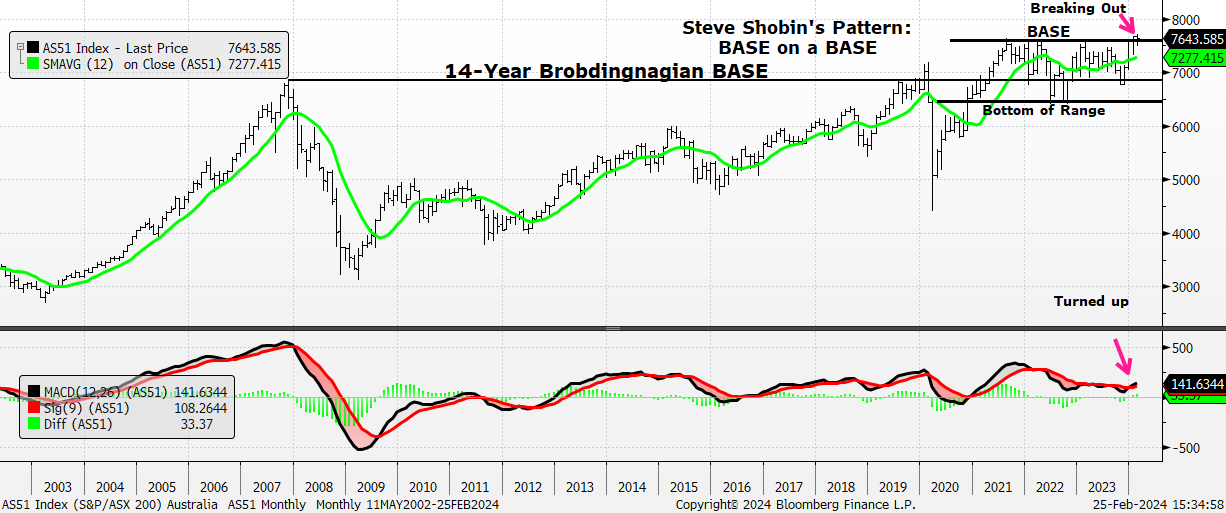
5 The S&P / ASX 200 Index of Australia is at a new all-time high?
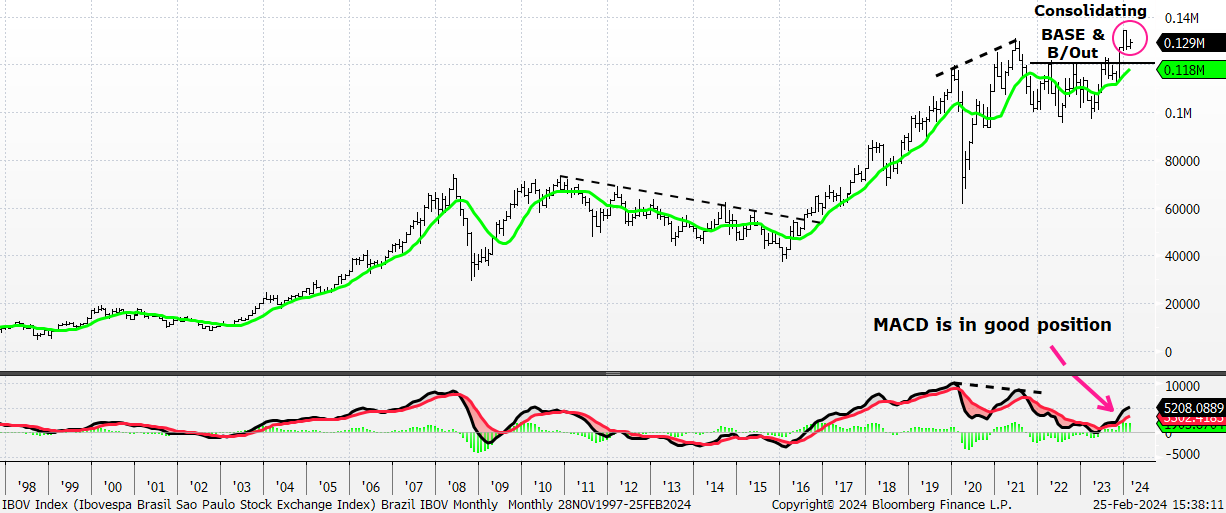
6 The IBOV of Brazil is consolidating at new highs and the S&P / BMV IPC of Mexico are at all-time highs?
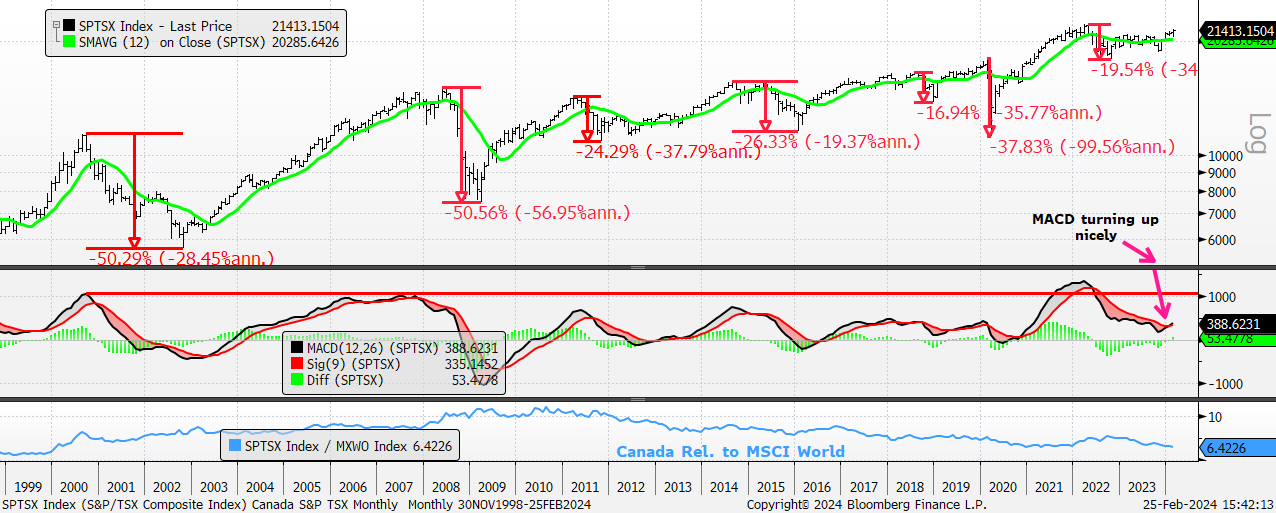
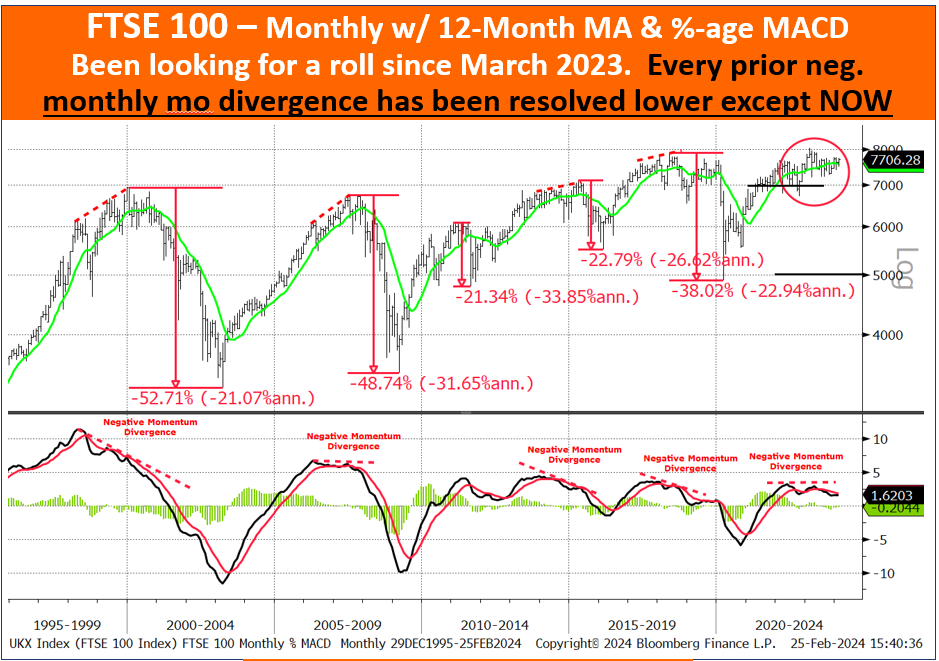
7 The S&P / TSX of Canada and the FTSE-100 are about 4% away from all-time highs?
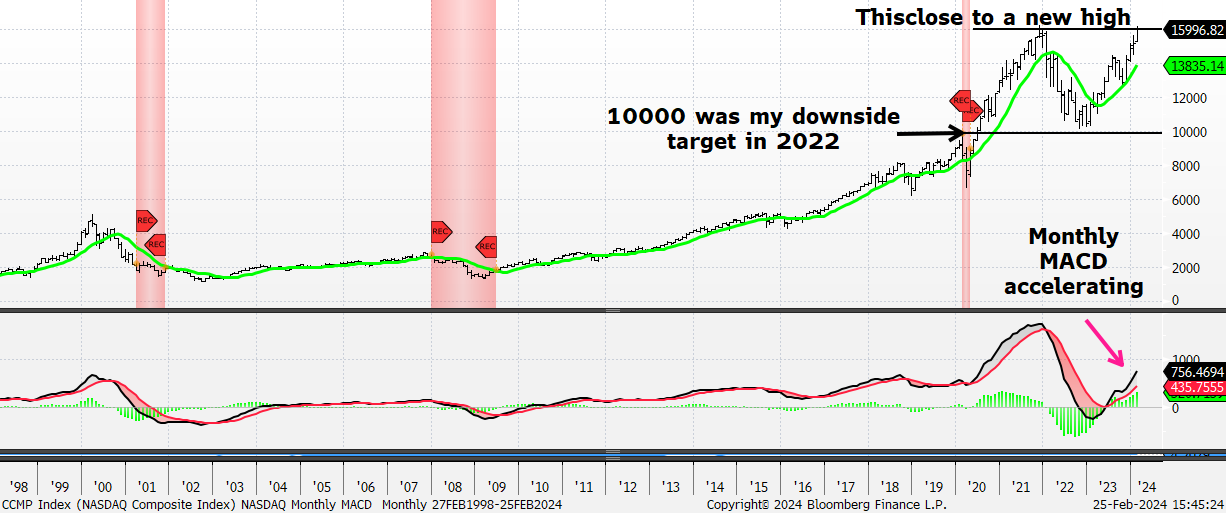
8 NASDAQ is 1.3% from an all-time high?
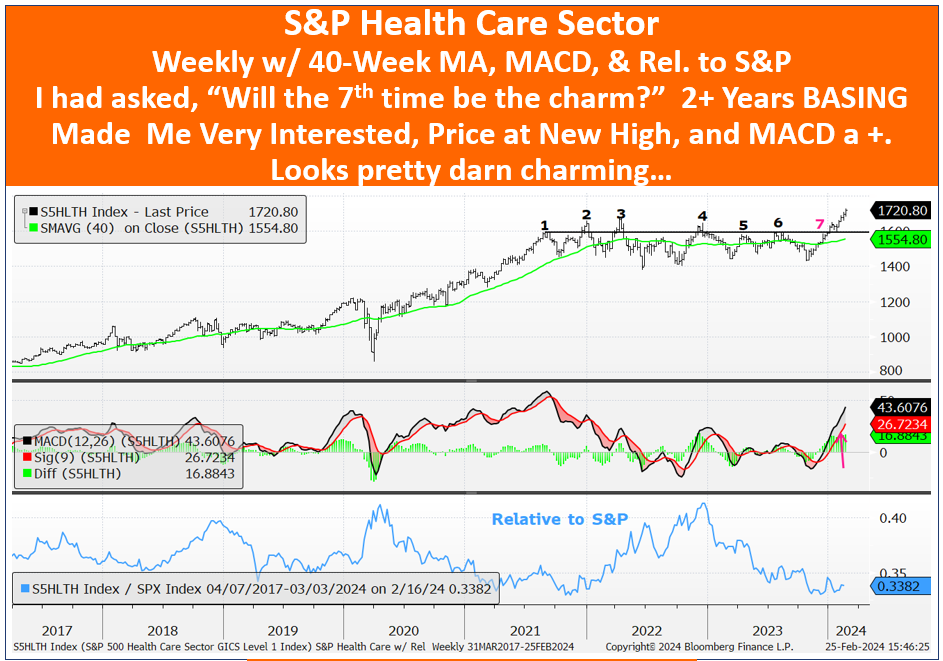
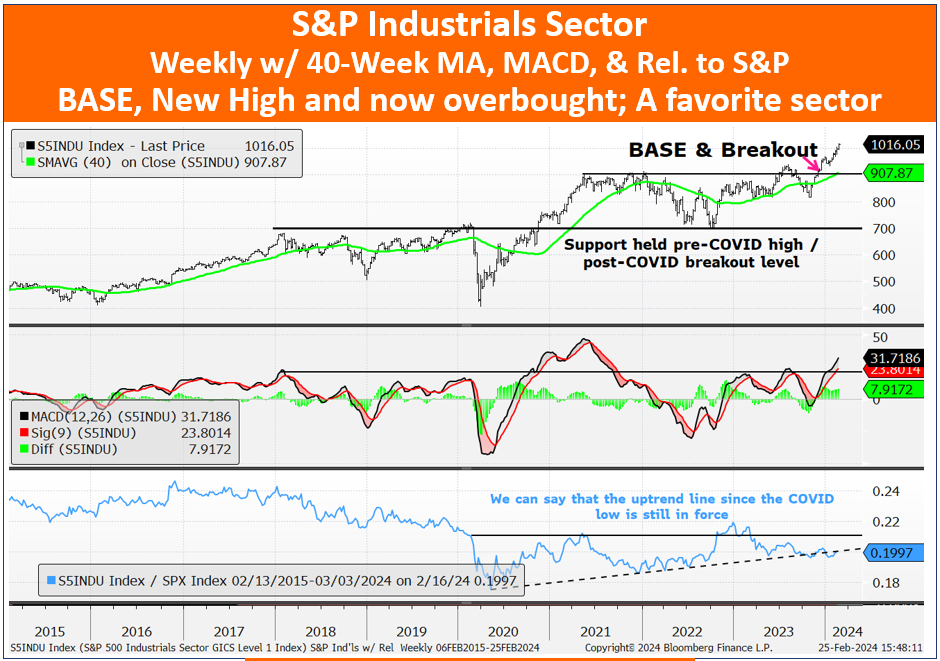
9 The S&P Healthcare and Industrials Sectors are at all-time highs?
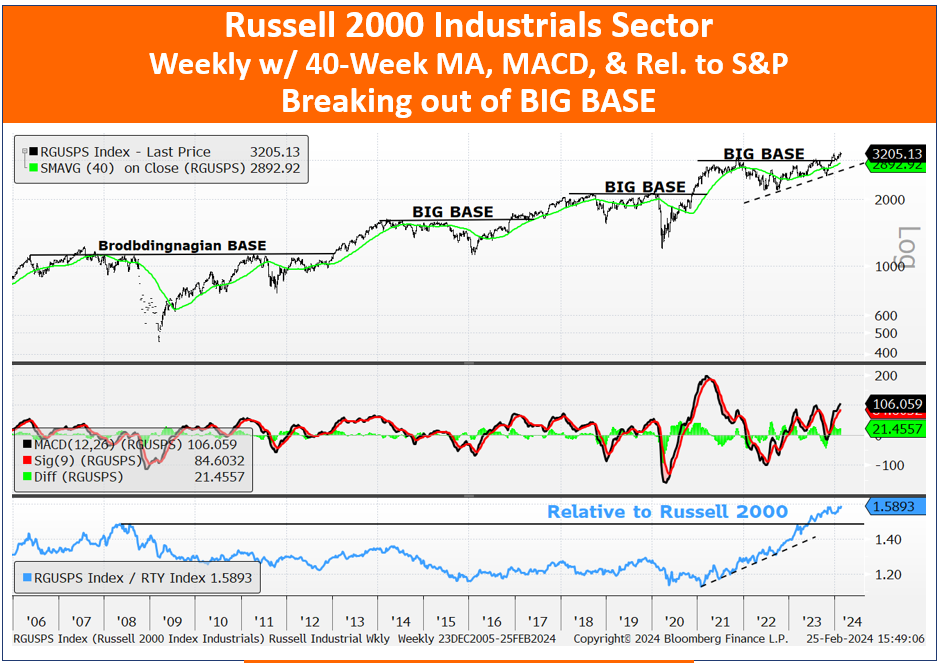
10 The Russell 2000 Industrials Sector, the largest Sector in the R2000 with a market cap weighting of 18.4%, is at a new all-time high?
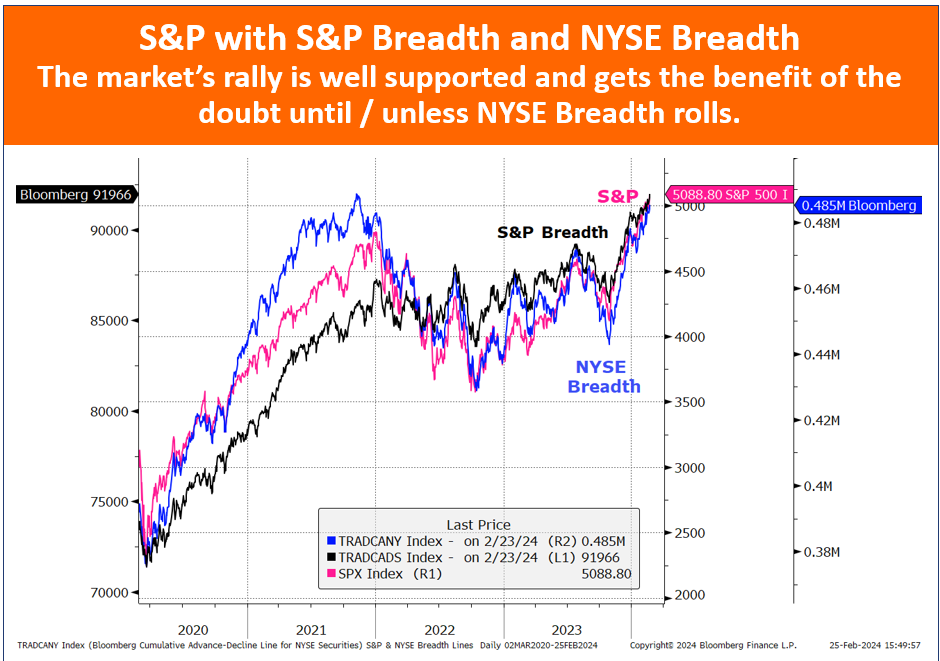
11 Cumulative Breadth for the S&P is at a new all-time high and Cumulative Breadth for the NYSE is less than 1% from moving above its Nov 2021 high?
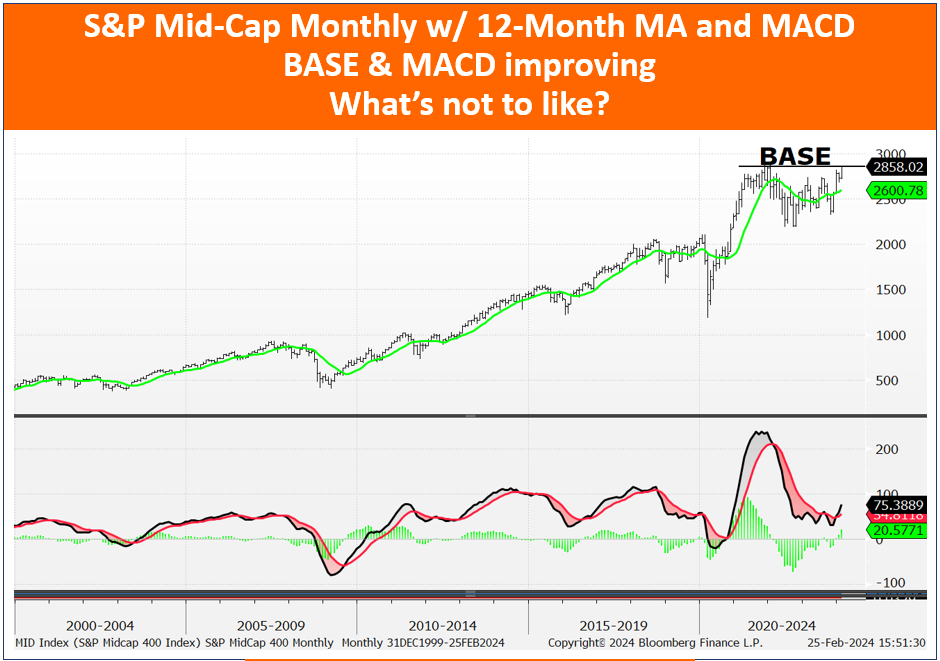
12 The S&P MidCap Index is 2.4% away moving above its Nov 2021 high?
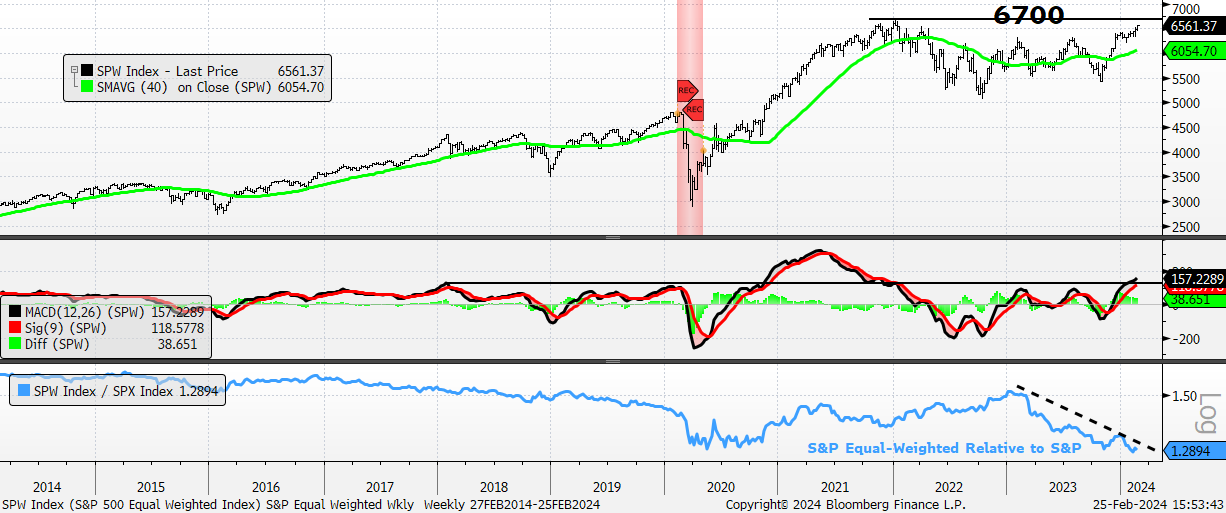
13 The Equal-Weighted S&P Index is 2% away from moving above its Jan 2022 high?
14 Since the beginning of 2024 over 37 trading days NYSE New 52-Week Highs have outnumbered NYSE 52-Week Lows 89% of the time?
15 The S&P has been higher in 15 of the last 17 weeks?
16 While the S&P is overbought across all periodicities, using data going back to early January 1960, a period of 3,347 weeks, I found four prior periods where the S&P displayed momentum thrust-like behavior and, in each case, (I realize this is not admissible in stats class, but it might be important in portfolio management class) the S&P did not put in an important top or experience a sharp correction until much after its initial momentum impulse. For example,
a) From Dec 9, 1960 – Mar 3, 1961, the S&P was up for 12 of 13 weeks where it added 13%. The S&P stayed strong into December 1961 adding another 13% from early March 1961 until the end of the year. A bear market began in mid-December 1961 and lasted until late June 1962 and the S&P dropped 28%.
b) From Mar 8, 1963 – May 10, 1963, the S&P rose for 10 weeks in a row gaining 9%. The S&P then continued to push higher, adding 25% in the process, until May 1965 when it had a one-month correction of 10%. Post the correction the S&P added another 15% into February 1966 when a bear market started (-22% through Oct 1966).
c) From Oct 4, 1985 – Jan 3, 1986, the S&P was up for 13 of 14 weeks where it jumped 15%. The S&P added another 17% into the end of 1986 and then, without too much of a breather, the index smoked higher by 36% (!) from late 1986 and into the third week in August 1987. August 1987 was the market’s peak and was followed by the “Crash of 1987” in October.
d) From Nov 28, 2003 – Mar 5, 2004, the S&P gained in 13 of 15 weeks where it tacked on 9%. The S&P only added another 5% from Mar 5 through the end of December 2004. It BASED in 2005 and then pushed higher by 22 ½% from November 2005 (with an 8% spring 2006 setback) until summer 2007 which was where the market peaked before anyone had an inkling about the oncoming GFC.
S&P / ASX 200 – Monthly w/ 12-Month MA and MACD
Ibovespa – Monthly w/ 12-Month MA and MACD
Canada S&P / TSX – Monthly w/ 12-Month MA and MACD
NASDAQ – Monthly w/ 12-Month MA and MACD
S&P 500 Equal Weighted – Weekly w/ 40-Week MA, MACD and Rel. to S&P