SUMMARY – Bottom Line To Start: Last week the Risk On Factor underperformance started to change. Deep Cyclicals significantly outperformed Defensives, SMID bounced and Low Vol factors underperformed. The reason, stronger economic growth has reduced the expected number of Fed rate cuts, but financial conditions have not tightened. That is consistent with our view that the economic data so far in 1Q24 has been consistent with a positive growth shock, vs an inflation shock. Last week’s Benign CPI revisions and the decline in the Atlanta Fed’s wage tracker helped reduce the risk of inflation remaining at too high of a level. It reinforced the positive growth shock, not inflation shock, theme.
That made the 3Q23 internal market playbook much less useful. 3Q23 was defined by economic growth being much stronger than expected and yields shooting higher. SMID, Value, Earnings Risk Factors and High Vol factors got killed. If CPI and Retail sales data is in line with consensus estimates this week, we would expect the firm economic growth with neutral financial conditions backdrop to continue.
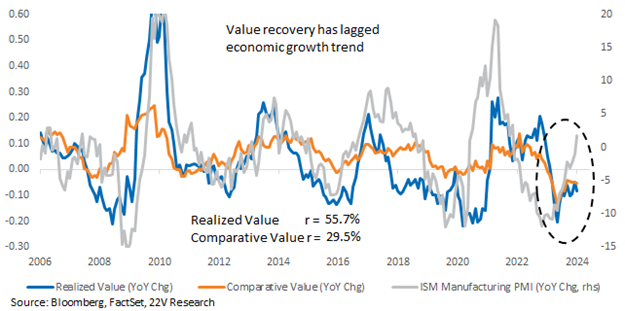
Also, expect some rebound in Value factors relative to the macro data. Value factor have significantly underperformed the YoY change in the PMI. We cover this in more detail in today’s Quant report (LINK).
At the start of 2024, we noted that the economic backdrop had firmed significantly and that the easing of financial conditions in 4Q23 would lead to a stronger economic growth in 1H24 vs muted consensus expectations for GDP growth. Some conclusions from that observation were that 1) better data would lead to increased growth expectations, 2) increases in vol/broad market selloffs would be opportunities to ADD to risk, 3) 4Q earnings data would again be surprisingly strong, and 4) the USD and 10yr yields would be biased higher.
Those trends are playing out, but inflation risk remains too high (covered above) and Earnings growth concerns, ex the mega 7, has been cited as a reason for risk on factors, or just the other 493 S&P 500 stocks underperforming.
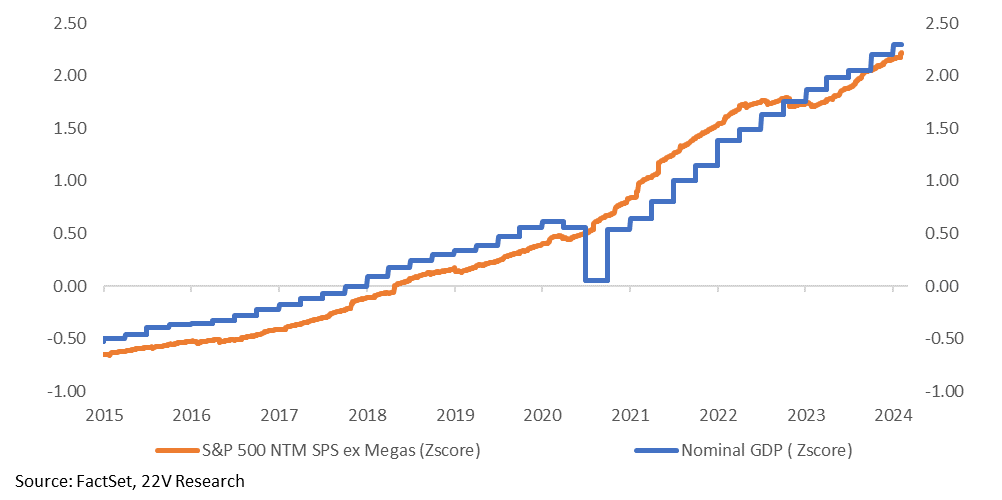
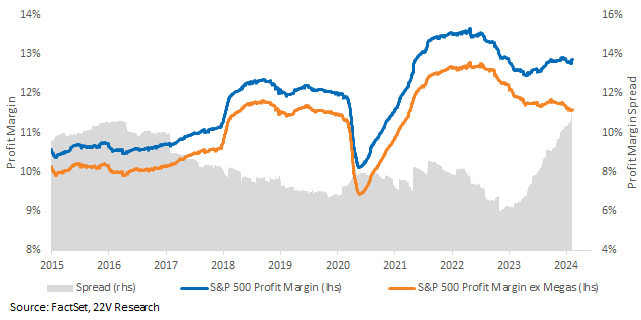
Don’t Extrapolate The Relative Earnings Weakness In The Other 493 S&P 500 Stocks: Sales expectations for the S&P 500 ex Mag 7 are climbing and moving in line with nominal GDP. Margins for the 493 have suffered relatively, but the trends in company sentiment toward margins and pricing power (pricing power was likely a large issue for the 493 last year) suggest that is about to change. Earnings for the other 493 should catch up some in the next couple of quarters.

Full report below…
MARKET VIEWS: 2024 has started out with stronger economic growth, that has significantly reduced the expected number of Fed rate cuts, but financial conditions have not tightened. That is consistent with our view that the economic data so far in 1Q24 has been consistent with a positive growth shock, vs an inflation shock.
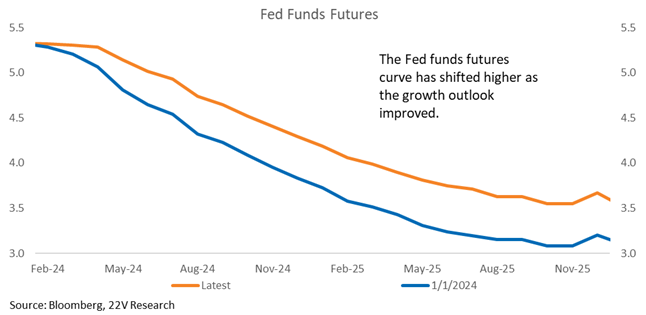
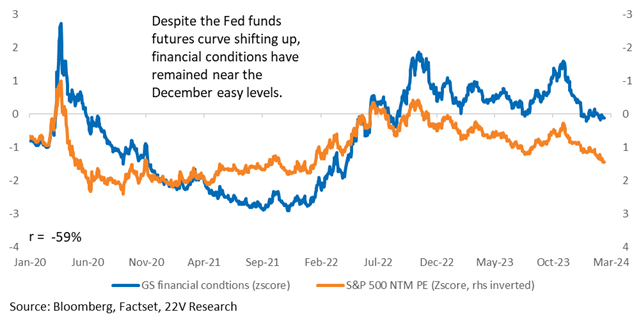
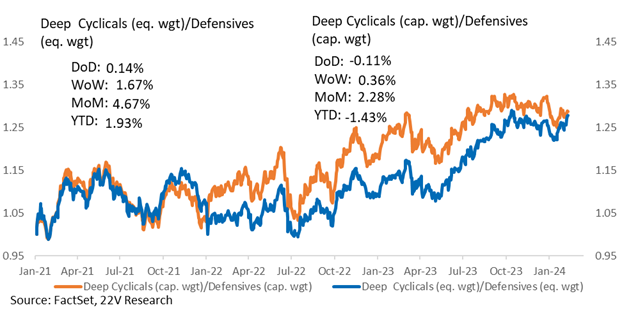
The risk of inflation remaining at too high of a level has increased as economic growth has surprised on the strong side. That explains some of the weakness in SMID, Value, Earnings Risk Factors and High Vol factors. As we noted yesterday though, benign CPI revisions and the decline in the Atlanta Fed’s wage tracker helped reduce the risk of inflation remaining at too high of a level. FYI – Deep Cyclicals have started to outperform Defensives, which would be consistent with reduced fears of the Fed short circuiting the cycle because inflation remains too high. CPI data tomorrow and Retail sales on Thursday will be important data points. If both data points are inline with consensus estimates, the financial conditions outlook is unlikely to change much.
Our latest investor survey show that firm data are causing a shift in investor expectations, with an increasing percentage seeing too strong growth as the most significant market risk. That is a noticeable shift from our surveys over the past few quarters and reinforces the bias toward Cyclicals, GARP, and risk-on factors. Assuming the risk of the Fed having to tighten more doesn’t increase, expect some rebound in Value factors relative to the macro data. We cover this in more detail in today’s Quant report (LINK).
Earnings & Margins Ex The Mega’s: Sales expectations for the S&P 500 ex Mag 7 are climbing. Without attempting false precision, they are moving up with nominal GDP. Nominal GDP growth has been firm and we expect it to stay that way.
EPS expectations are NOT moving up though. Margin expectations ex the Mag 7 have been paltry. The bid to the mega cap names makes sense in this context.
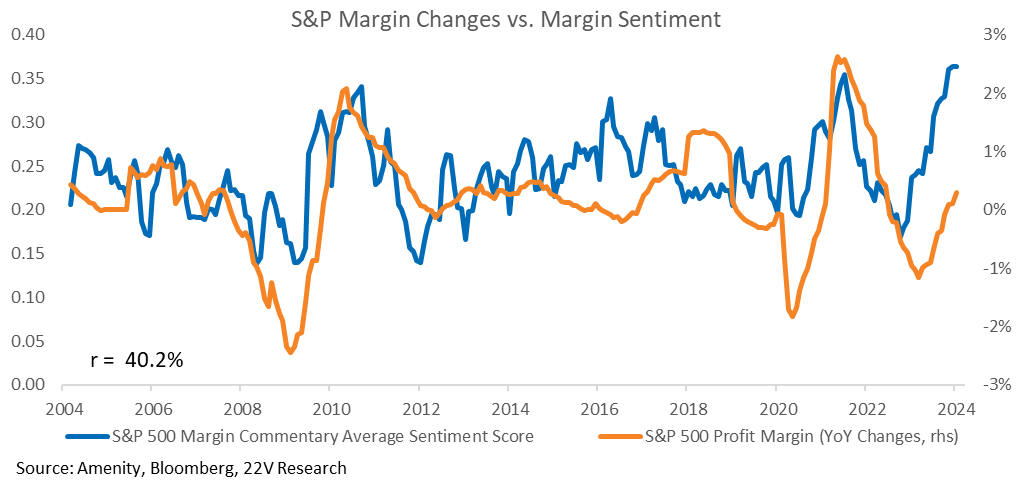
Margin sentiment, which we show on an equally weighted basis below (So ex Mag 7 it would look about the same), has improved materially. With margins likely to improve for the other 493 and sales tracking nominal GDP estimates, there seems like decent earnings upside to the other 493 companies. FYI – Margin sentiment is correlated with actual margin results one quarter out, so the sentiment readings are another sign, along with strong growth data, that profitability is not at risk near-term.
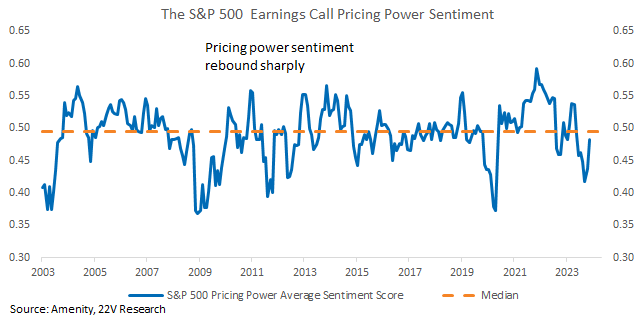
In addition, sentiment toward pricing power – views related to product or service prices – have rebounded and climbed sharply over the past two weeks along with rebounding price sentiment. Both support margins. Given the profitability charts of the Mega 7 vs the 493 S&P 500 companies we highlighted above, it seems logical that the other 493 S&P companies suffered more severely from the decline in pricing power sentiment last year. The recent rebound in pricing suggests some tailwind to the other 493 S&P companies over the coming quarters.
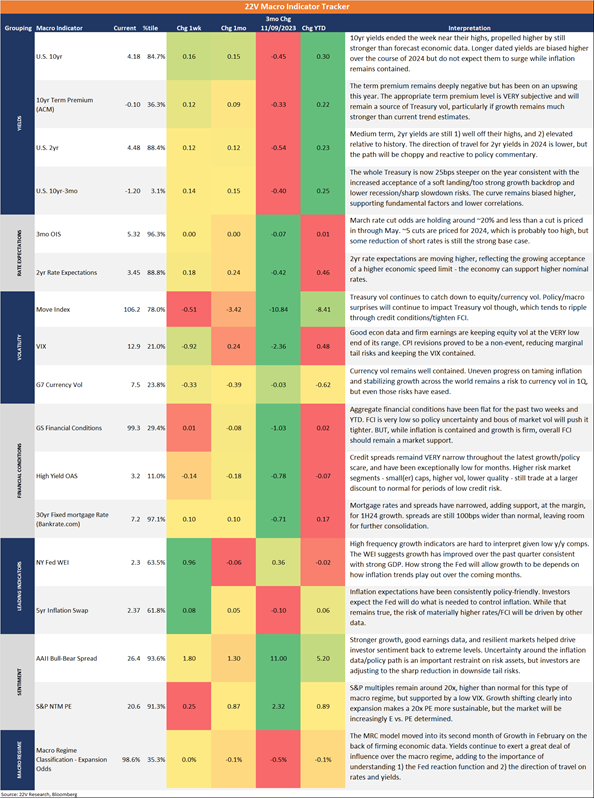
Macro Tracker: It won’t be a straight path, but risk assets remained biased higher this year. At the start of 2024, we noted that the economic backdrop had firmed significantly, and the risks to growth trends were much more likely to be on the upside than the downside. Some conclusions from that observation were that 1) better data would lead to increased growth expectations, 2) increases in vol/broad market selloffs would be opportunities to ADD to risk, and 3) 4Q earnings data would again be surprisingly strong. The first few weeks of January saw a selloff led by risk-off factors, followed immediately by a rebound in small(er) caps and risk factors that took the S&P to a new cycle high. The most recent bout of market weakness again saw risk-off factors surge, a trend that started to reverse after the benign CPI revisions late last week. Internally, price momentum and GARP worked well across the broad equity market. Very large-cap stocks (OEX) were still a bit of an outlier, with Earnings Turbulence being the most influential factor. Our latest surveys show that data are causing a shift in investor expectations, with an increasing percentage seeing too strong growth as the most significant market risk. That is a noticeable shift from our surveys over the past few quarters and reinforces the bias toward Cyclicals, GARP, and risk-on factors. What would change that conclusion? If growth remains too strong or inflation data moves higher, the Fed must tighten financial conditions materially. That risk remains low for now, so selloffs based on the “too strong growth means tighter FCI” narrative remain buying opportunities.