Back Economics

Is the “required,” by which we mean likely, real wage catch up a high 5% or a low 0%?

Published on January 31, 2024

∙ Download the PDF Report

By

Gerard MacDonell

It is not the main focus for today, obviously, but while waiting for the Fed I thought I would take account of Jason Furman’s recent point that real wages are 5% below trend, which apparently is making the rounds (HERE). If that is true, then real wage growth could run well above presumed trend productivity for a while with no implications for inflation, but with somewhat negative implications for margins.

This would be a huge deal if representative

A graph with a line and a line

Description automatically generated
Source: Jason Furman, via X

But it doesn’t seem to be true, and in this note I explain why, trying to be as transparent as possible so that you can follow along and judge for yourself.  Let’s start with Furman’s main bit of evidence, which I copy above.  The ratio of ECI wages to the headline CPI is 5% below trend, as shown in the chart above.  It seems simple enough. 

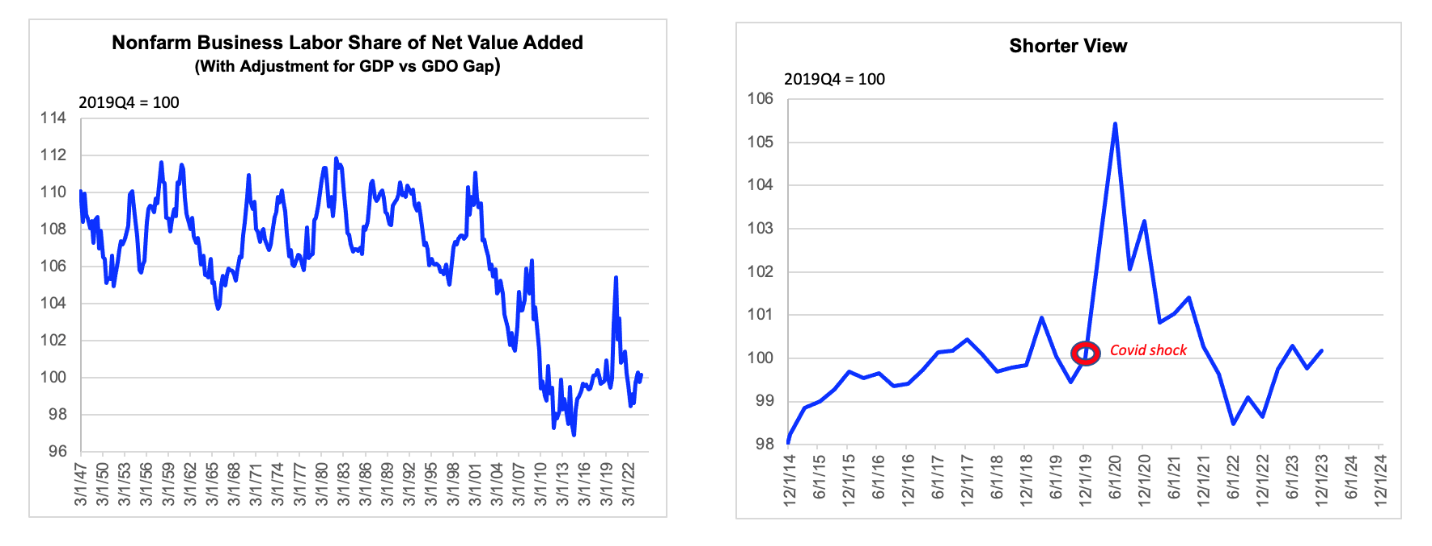
The straightforward implication of that claim is that the labor share is somehow also 5% below some sense of normal.  Sorry to put words in Dr. Furman’s mouth, but if that is not the implied claim then he does not have a relevant one.  And that is provocative because I have a direct measure of the labor share that is 0% below normal, at least if we take the pred-Covid level, rather than say the postwar average, as our benchmark of “normal.” 
A graph of a stock market

Description automatically generated with medium confidence
Source: BEA (for adjustments), Federal Reserve Bank of St. Louis (FRED)
Data are actual to Q3 and consensus estimates for Q4. I am showing levels, so the consensus being slightly off on the growth rates will not matter much.

What is going on here?  Well, that is actually an answerable question, using arithmetic.  We can quibble about the meaning of the accounting, but the accounting itself is unavoidable.  So, let’s do the numbers.

First, my measure of the labor share makes an adjustment for the statistical discrepancy in the National Accounts.  Most people would not do that, preferring to take the implied labor share from the Productivity and Cost report at face value.  So, in the interest of transparency, let’s reverse out that adjustment.  That gets me to a labor share that is 1.1% below its immediate pre-Covid level (not shown).  There is no way that such a tiny gap could rationalize a catchup effect in real wages, particularly one that seems to be accelerating.   In other words, my more hawkish take here does not really lean much on the adjustment for the statistical discrepancy. I just figure the adjustment is appropriate.

But what of the remaining four percentage points? Unavoidable accounting identities dictate that it has to be some combination of the following three items:

·      Nonfarm business sector productivity growth has been weaker than is implied by extrapolating the period immediately pre-Covid.

·      Average hourly compensation has been faster than the core ECI.

·      The output price deflator for the business sector has risen less quickly than the headline CPI.

In fact, all three of these factors have contributed.  Cumulative productivity growth since Covid has been around its structural of 1.1%, even though it grew at 2% (ar) during Furman’s trend period.  Average hourly compensation is up a cumulative 23% vs the 18% rise of the ECI wages and salaries. And the CPI has risen 19% cumulatively vs the 17.4% rise in the business sector’s output price deflator.  It is not surprising that the deflator has not risen as much as the CPI because the CPI is heavily overweight rents, as you know. Away from that, I have not actually looked into how the relative price of consumer prices and business sector output prices has evolved. But I do know – with as much certainty as macro allows – the deflator is the relevant price index here. 

Let me conclude by addressing what might seem to be a cheat here? If average hourly compensation is the better measure of wages, then why do we all look at the ECI? Can’t have it both ways. Actually, we can. For the purposes of assessing the underlying rate of wage growth, we watch the ECI. For the purposes of watching the level of the labor share, we have to take account of all labor costs, even if doing so introduces volatility in the reported quarterly growth rates. Such volatility is not a worry when assessing the level. 

To repeat, this is not the main thing for today.  But it is something on which I have a relatively informed (by my own standards) view. 

DISCLOSURES AND DISCLAIMERS

Analyst Certification

The analyst, 22V Research Group, primarily responsible for the preparation of this research report attests to the following: (1) that the views and opinions rendered in this research report reflect his or her personal views about the subject companies or issuers; and (2) that no part of the research analyst’s compensation was, is, or will be directly related to the specific recommendations or views in this research report.

Analyst Certifications and Independence of Research.

Each of the 22V Research analysts whose names appear on the front page of this report hereby certify that all the views expressed in this Report accurately reflect our personal views about any and all of the subject securities or issuers and that no part of our compensation was, is, or will be, directly or indirectly, related to the specific recommendations or views of in this Report.

22V Research (the “Company”) is an independent research provider. The Company is not a member of the FINRA or the SIPC and is not a registered broker dealer or investment adviser. 22V Research has no other regulated or unregulated business activities which conflict with its provision of independent research.

22V Research, LLC is a professional services and independent publication organization. 22V Research, LLC is not a securities broker-dealer, not a member of the Financial Industry Regulatory Authority (FINRA), not a registered investment advisor (RIA) and not a member of SIPC.

Securities transactions, when offered, are offered by 22V Securities, LLC through LPS Capital, LLC. Certain employees of 22V Securities, LLC are dually registered as securities representatives of LPS Capital, LLC or Analyst Hub Securities, LLC. 22V Securities, LPS Capital and Analyst Hub Securities are members FINRA, SIPC.

https://brokercheck.finra.org/

Current Ratings Definition.

SECTOR OUTPERFORM: An “outperform” rating anticipates the company will outperform the S&P Regional Banking Index (peer group).

SECTOR PERFORM: A “market perform” rating anticipates the company will perform in line with the S&P Regional Banking Index (peer group).

SECTOR UNDERPERFORM: An “underperform” rating anticipates the company will underperform the S&P Regional Banking Index (peer group).

Limitation Of Research And Information.

This Report has been prepared for distribution to only qualified institutional or professional clients of 22V Research Group. The contents of this Report represent the views, opinions, and analyses of its authors. The information contained herein does not constitute financial, legal, tax or any other advice. All third-party data presented herein were obtained from publicly available sources which are believed to be reliable; however, the Company makes no warranty, express or implied, concerning the accuracy or completeness of such information. In no event shall the Company be responsible or liable for the correctness of, or update to, any such material or for any damage or lost opportunities resulting from use of this data. Nothing contained in this Report or any distribution by the Company should be construed as any offer to sell, or any solicitation of an offer to buy, any security or investment. Any research or other material received should not be construed as individualized investment advice. Investment decisions should be made as part of an overall portfolio strategy and you should consult with a professional financial advisor, legal and tax advisor prior to making any investment decision. 22V Research Group shall not be liable for any direct or indirect, incidental or consequential loss or damage (including loss of profits, revenue or goodwill) arising from any investment decisions based on information or research obtained from 22V Research Group.

Reproduction And Distribution Strictly Prohibited.

No user of this Report may reproduce, modify, copy, distribute, sell, resell, transmit, transfer, license, assign or publish the Report itself or any information contained therein. Notwithstanding the foregoing, clients with access to working models are permitted to alter or modify the information contained therein, provided that it is solely for such client’s own use. This Report is not intended to be available or distributed for any purpose that would be deemed unlawful or otherwise prohibited by any local, state, national or international laws or regulations or would otherwise subject the Company to registration or regulation of any kind within such jurisdiction.

Copyrights, Trademarks, Intellectual Property.

22V Research Group, and any logos or marks included in this Report are proprietary materials. The use of such terms and logos and marks without the express written consent of 22V Research Group is strictly prohibited. The copyright in the pages or in the screens of the Report, and in the information and material therein, is proprietary material owned by 22V Research Group unless otherwise indicated. The unauthorized use of any material on this Report may violate numerous statutes, regulations and laws, including, but not limited to, copyright, trademark, trade secret or patent laws.
