

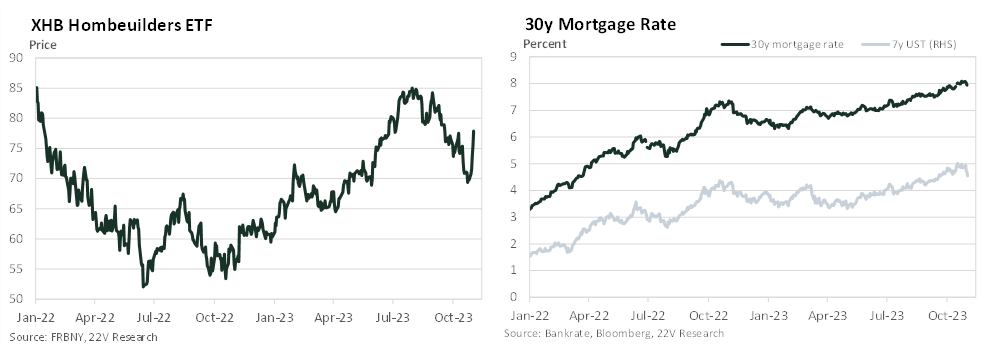
Homebuilding stocks (the XHB ETF) have staged a >12% rally since last Wednesday, with the move up beginning before rates staged their dramatic rally over the past 3 days but most of it coming along with rates. XHB is now down ~8% from its end-July value, a bit less than the equal-weight SP500 (-10%).
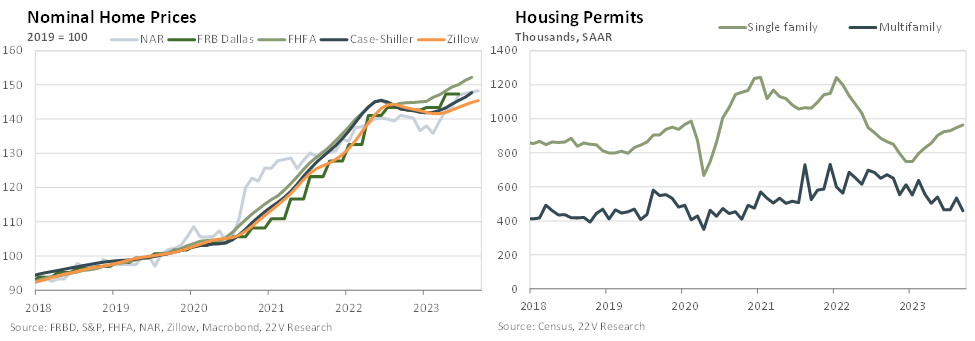
Their performance combined with the notable recent stability of housing starts, since their initial leg down after the hiking cycle began, suggests to us that the implied housing market reacceleration floor in rates (i.e. at what point the housing activity will accelerate not just near-term stabilize) has been creeping higher as builders find work arounds and consumers partially adapt to, or perhaps more accurately becoming begrudgingly tolerating of, higher rates and fairly sticky prices. This is of course a bit tentative of a concept and will need to be seen inferred based off the hard data to come in 23Q4-24Q1.
The performance of homebuilders contrasts with late-2018 when they were making relative lows amid fears of Fed overtightening at peak rates and Chair Powell’s “long-way from neutral” talk.[1]
If long-term US rates keep rallying, tight FCIs talk may not be able to last too much longer (of course there are some natural lags between UST rates to mortgage rates to housing activity, in addition to inertia in Fedspeak).
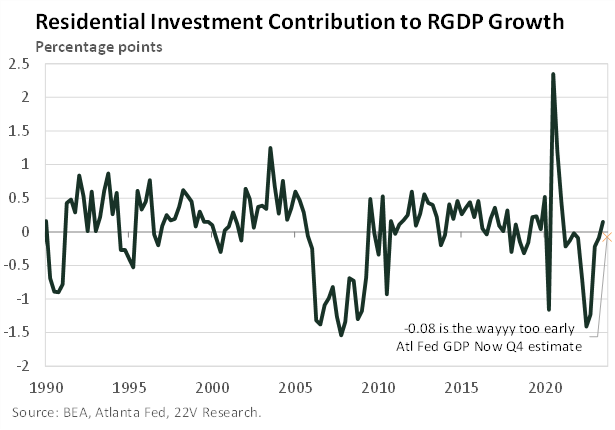
At a minimum, housing activity (in a GDP-and construction employment-related sense) has been much more robust than standard mortgage payment-to-income dynamics would suggest. This isn’t to say that there hasn’t been a hit with 22H2 q/q contributions to growth as bad as those seen during the GFC but the flattening out in activity has come more quickly, and house prices stayed higher, than broadly expected. That the broader economy survived this sharp recession in the most classically cyclical part of it[2] is one of my main reasons for medium-term optimism.
At least some of this is likely because existing home sales and listings were sharply negative for much of the past year, although they are now turning roughly flat y/y but have moved only mildly in NSA volume terms since late spring.[3] Given that starts, much more than housing prices,[4] are usually what bears the greatest part of rate-driven adjustments in the housing market, this strength relative to expectations suggests that either demographics (millennial aging into first-time home buying years and incomes in larger numbers), wealth gains, or changes in household consumption preferences are supporting the market. One could frame this strength-to-date as a flash in the plan that is likely to dissipate if existing sales start to increase in volume terms (sellers are forced to by life events) or the consumer just runs out of ability to keep paying.[5]
My own view is that the shifts outlined above, along with strong builder incentives to help consumers meet underlying housing demand needs through buydown and mix-shift in construction, will help keep a soggy floor under single family starts if or until the broader labor market starts to materially soften, even if rates just move sideways from here. Multifamily activity, by the nature of the building boom and the shorter-liability structure of most of the borrowers, seems notably more challenged and seems likely to bullwhip down below 2019 levels over the coming year.
For the more medium-term outlook this means that while residential investment is unlikely to be as positive a contributor to GDP growth as it was in Q3, and a reasonable forecast suggests it will be a mildly negative contribution in Q4, it may not weigh on activity to the extent many forecasts seem to have implicitly assumed, especially if rates stay near here for some time (helpful for both USTs but also the vol-driven spread component in mortgage origination rates).
The Fed’s strong shift towards using higher rates as a reason against hiking in Dec may create a complicated messaging problem if FCIs keep easing, while at the same time inflation’s progress towards 2% decelerates and growth, especially in the labor market, remains healthy. In the first order the Fed may talk up, correctly, the increasing odds of a soft-landing but too-much FCI easing could ultimately lead to a hawkish shift again down the line.
Tip of the hat to the client who’s conversation and insights helped catalyze me into finalizing this piece. ↑
See “Housing IS the Business Cycle” and “Housing Dynamics Over the Business Cycle” ↑
See this excellent overview piece from the New York Fed in 2021 here; the conclusion states “our empirical estimates and prior studies suggest that the decline in mortgage rates can only explain low single-digit house price increases. Instead, we find that housing activity, both sales and construction, are very sensitive to interest rates.” ↑
The Chicago Fed has a nice piece, which lays out a relatively less optimistic case on the medium-term housing market here. This is I think the plausible bear case for starts but misses some of the more base case dynamics we have seen so far with demand and supply keeps starts + permits elevated. Although it implicitly highlights the possible risks to house prices if we see a very large increase in existing sales at current mortgage rates (fairly unlikely in the near-term). ↑

