SUMMARY: Our call is to be long “destocking losers” (retail and transports), long small caps relative to large, and long Deeper Cyclicals. The recent outperformance of Momentum factors should reverse some as well. Those calls are based on the idea the economy is still in a Transition phase (HERE), a period defined by conflicting data points that could break to either recession or back to normal growth. These periods are generally associated with higher-than-normal factor and sector mean reversion and larger-than-normal macro influence on volatility.
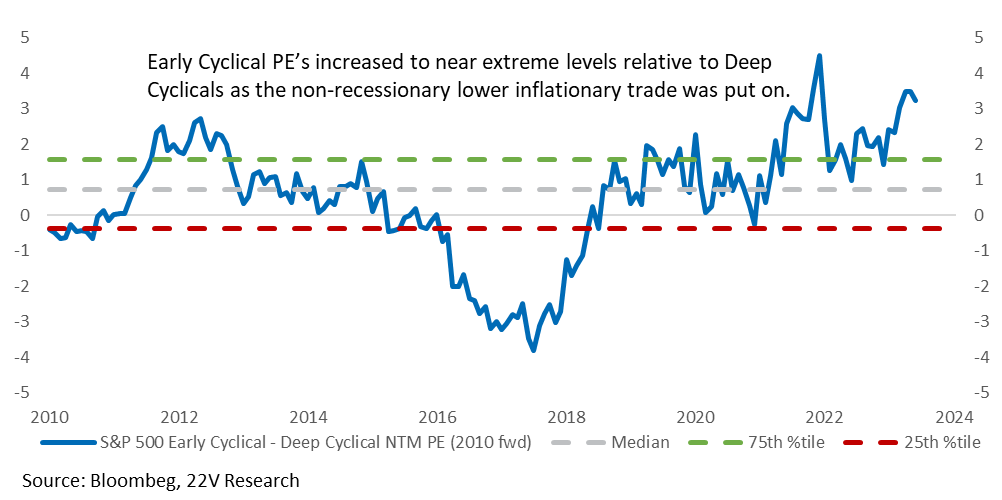
With economic growth much stronger than anticipated (our investor surveys pointed to 80-90% odds of recession for most of 2023), wages still running above 4%, bank strains abating, and small and medium-sized banks increasing C&I loans last month, being short more economically sensitive names makes less sense today. Early Cyclical PEs (Tech, Discretionary, Comms) are near extreme levels relative to Deep Cyclicals (Energy, Materials, Industrials). The median NTM PE spread between early and deep cyclicals (2010 forward) is in its 98th %tile.

If you believe Deep Cyclical earnings are about to collapse, the 98th %tile PE spread between Early and Deep Cyclicals could make sense. But firm economic growth and lower hard landing odds should reduce that risk. That is why we expect some mean reversion in Deep Cyclicals.
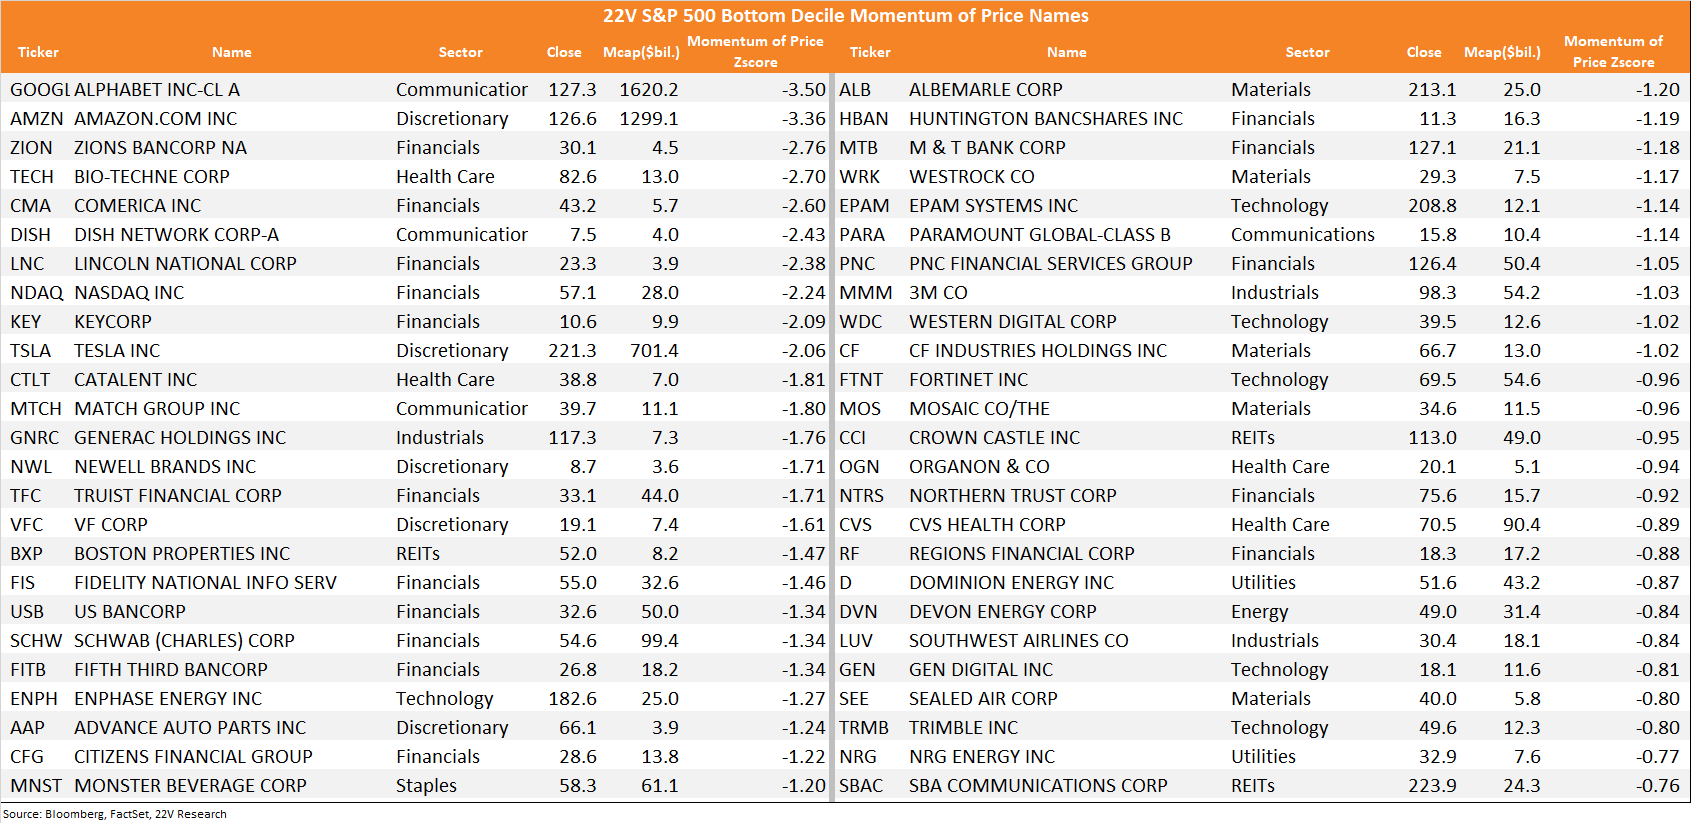
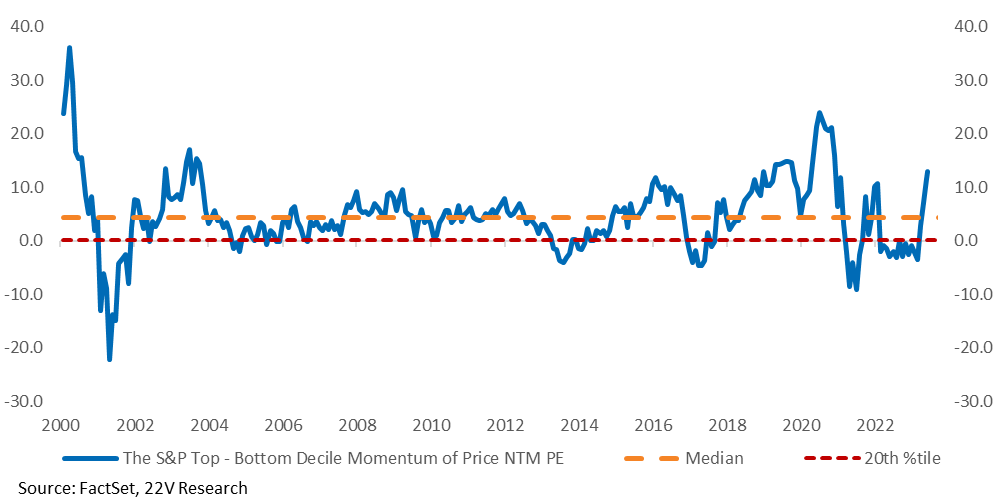
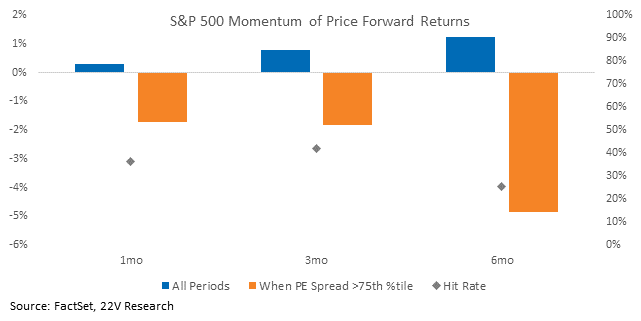
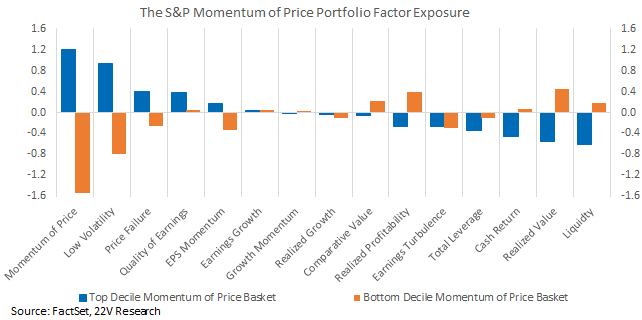
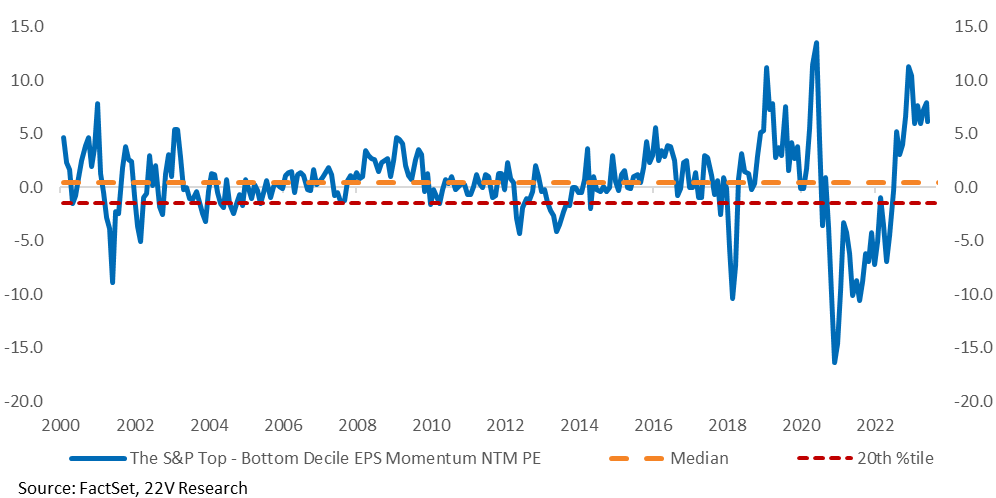
Other Extreme PE Spreads: The spread between the median PE in the top decile of Momentum of Price names vs the bottom decile is in its 98th percentile. It has only been wider during the TMT bubble and COVID. The PE spread could stay wide for months/quarters, but forward returns, on a 1, 3 and 6 month basis, to high Momentum are significantly worse than normal when the PE spread moves above its 80th percentile. Low Momentum stocks are underexposed to Low Volatility and other risk-off factors. A similar valuation spread has opened in the high vs low Earnings Momentum names.
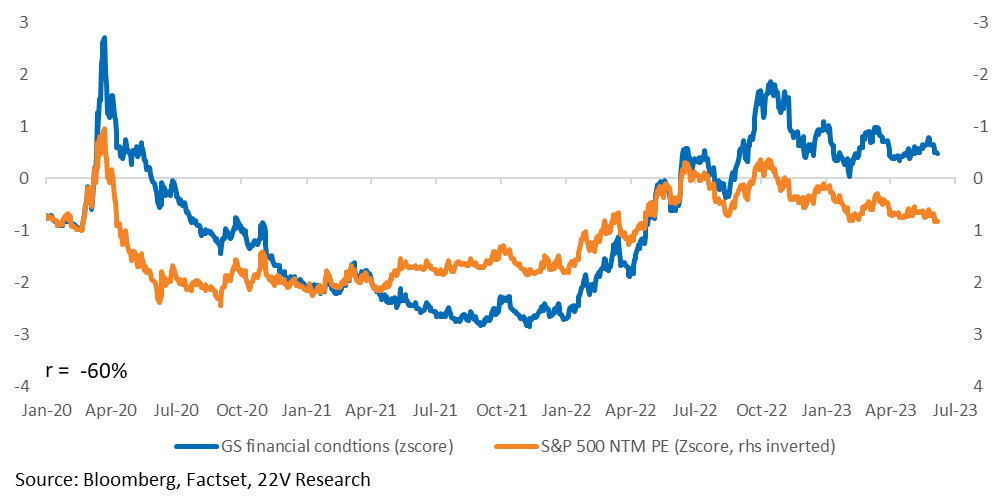
The Risk: Forward rates markets are pricing in a Fed pause on June 16th, but a hike on July 27th. Gerard has reclassified that as a “skip.” Since that is already priced, it shouldn’t change Financial Conditions (FCI) much. If Powell SOUNDS like he thinks economic growth needs to be ratcheted down more quickly, that will be a problem. FCI would tighten and recession odds would go up. We don’t think that will happen June 16th, but it could. The Fed could signal more urgency to slow economic growth at the press conference and the new Summary of Economic Projections (SEP).
Last Point: All the above doesn’t mean the trend will change, it just means some reversion. We hope that point is clear. Our longer-term call remains lower inflation and more labor market loosening.
Full report below…
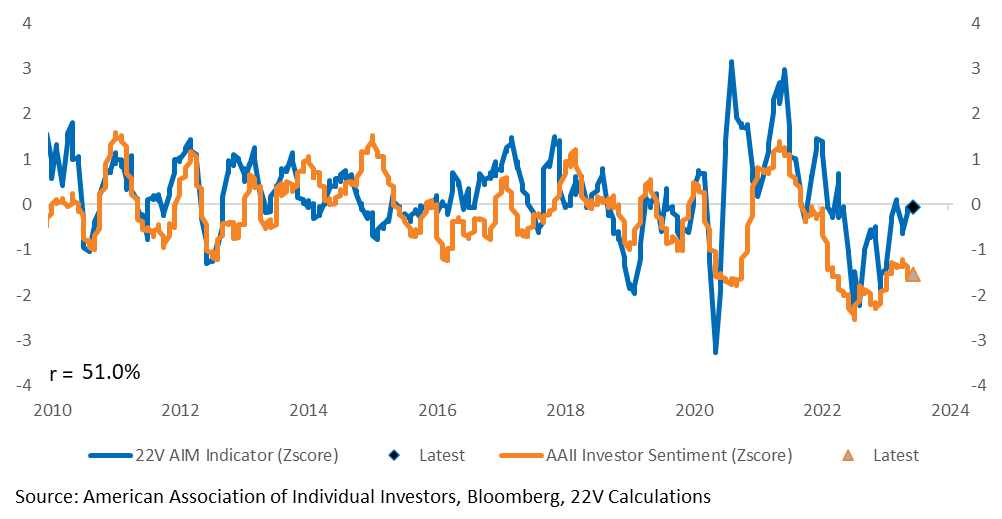
MARKET VIEWS: The pretty consistent feedback from our meetings over the past 3 to 4 weeks is clients are giving up on near-term recession risk and increasing odds of a soft landing. We agree on the very low near-term recession risk and have made that call consistently. We are 52/48 (as non-committal as you could be on a base case) on a soft landing, and our odds have not changed on that. Labor market loosening still needs to happen. Anyway, the breadth of economic data has improved relative to investor sentiment (we use the AAII bull-bear spread). In other words, investors have been more pessimistic than economic data would suggest. Forward returns are typically more positive when this is the case, which has happened. Investor sentiment seems to be shifting higher now.
The first expression of soft-landing odds increasing showed up in the outperformance of big cap Tech and equities in general. Biotech and ARRK outperformed as well (both are NOT safety trades and are +20% since March). AI beneficiaries, Biotech, and ARRK represent the non-recessionary, but still weak econ growth and lower inflation backdrop trades. Tighter credit spreads reflected that as well. Early Cyclical PEs (Tech, Discretionary, Comms) increased to near extreme levels relative to Deep Cyclicals (Energy, Materials, Industrials) as the non-recessionary lower inflationary trade was put on. The median NTM PE spread between early and deep cyclicals (2010 forward) is still in its 98th %tile.
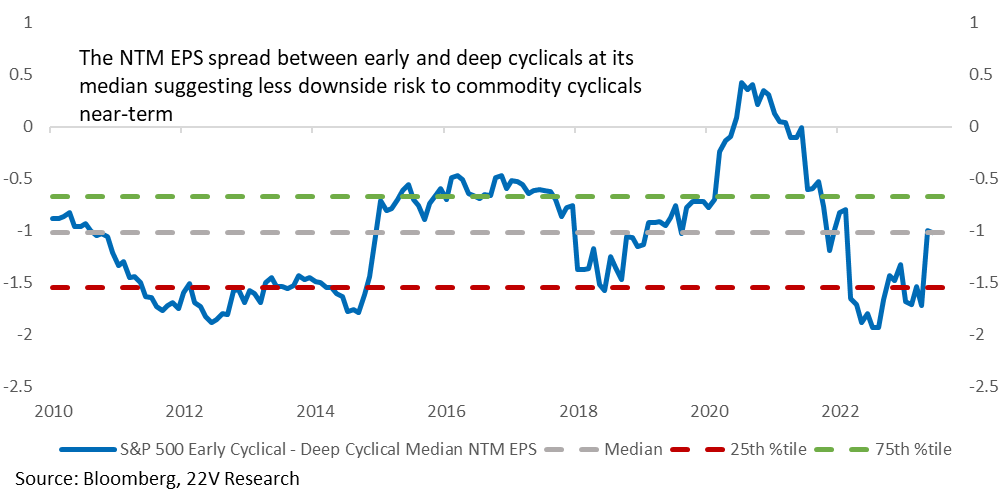
With economic growth much stronger than anticipated (our investor surveys have pointed to 80-90% odds of recession for most of 2023), wages still running above 4%, bank strains abating, and small and medium sized banks increasing C&I loans over the past month, being short more economically sensitive names makes less sense. Those earnings are likely to hold up. Despite the unusually high PE spreads between Early and Deep Cyclicals, the NTM EPS spread between the two is at the historic medium. If you believe Deep Cyclical earnings are about to collapse, the PE spread would make sense. But firm economic growth and lower odds of a hard landing should reduce that risk. That is why we expect some mean reversion in Deep Cyclicals or commodity sensitive Cyclicals.
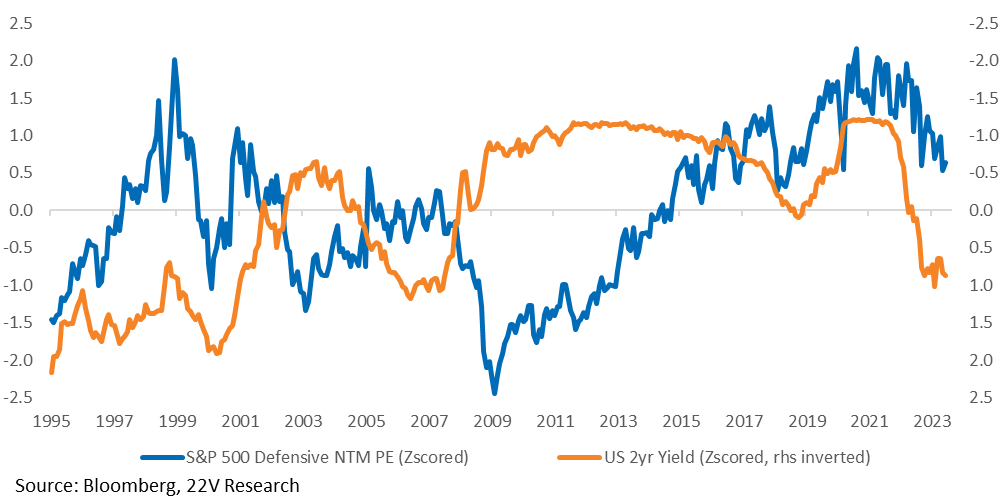
Lower recession odds helped push 2yr yields higher, which is a major headwind for Defensives. The 2yr yield has climbed back above 4.5% and continues to put downward pressure on defensives multiples. After there is some labor loosening this summer or early fall, expect 2yr yields to come back down and stabilize Defensives. For now, Defensives remain at risk.
Other Extreme PE Spreads: The spread between the median PE in the top decile of Momentum of Price names vs the bottom decile is in its 98th percentile. It has only been this high in the TMT bubble and during COVID. The PE spread could stay wide for months/quarters…
… but the forward return of Momentum or Price is significantly worse than normal when the spread is above its 80th percentile.
The High Momentum basket is more risk-off exposed and has positive Value exposure. The Low Momentum basket has the opposite.
A similar valuation spread has opened in EPS momentum. Given the still strong mean reverting characteristics of markets (a core theme of ours), expect some mean reversion in Price Momentum and Earnings Momentum factors. That doesn’t mean the trend will change, it just means some reversion. We hope that point is clear. Our longer-term call is lower inflation.
FYI On Risks to The Above: The Cyclical and risk-on factor calls will run into trouble if financial conditions tighten meaningfully. Forward rates markets are already pricing in a Fed pause on June 16th and a hike on July 27th. That appears to be the base case and Gerard has moved to that view. With that path already priced, FCI vol should be low. If Powell SOUNDS like he thinks economic growth needs to be ratcheted down more quickly, that will be a problem. We don’t think that will happen, but it could. The press conference and new Summary of Economic Projections (SEP) is where the to look for signals about more urgency to slow economic growth.
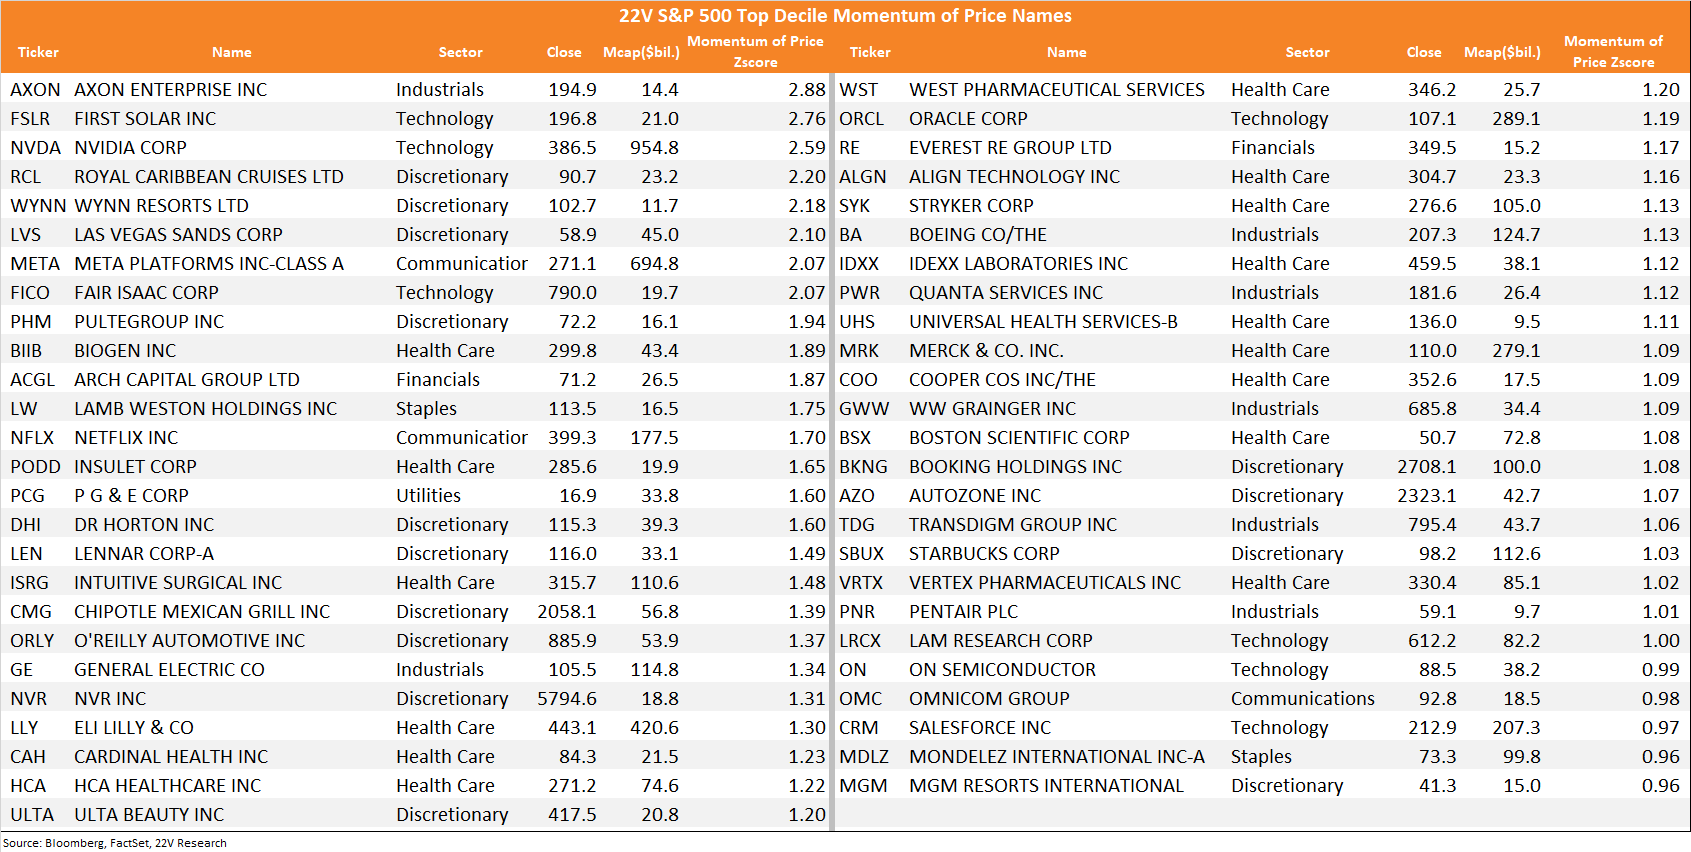
High Momentum of Price Basket:
Low Momentum of Price basket: