Back Economics

US corporate profitability has indeed been falling

Published on May 31, 2023

Download the PDF Report

By

Gerard MacDonell

This note follows up more deliberately on a point I made while rushed after the National Accounts profits data for Q1 were released last Friday.  The apparent decline of US corporate profitability is not an illusion created by losses at the Fed or by the distorting influence of the Capital Consumption Adjustment (CCA).

The Fed losses are indeed a source of noise, but they were largely offset by odd strength in the profits of truly private financial businesses. As a result, overall financial profits have not changed much recently, which has meant that we see qualitatively the same pattern in nonfinancial profits (on domestic operations) that we see in the headline all-sector global profits data.  

Separately, there is a very good reason to include the CCA in the depreciation and therefore profits data. Removing its influence would introduce, rather than correct, an error. Some analysts prefer to look at cash flow, rather than profits.  And not being a strategist, I do not have a view on that. But there is no point in torturing profits so that they look more like cash flow. Deprecation detracts from profitability for obvious reasons. We might as well try to measure that fairly. 

In the remainder of this note, I will focus on how the CCA has affected profitability in the domestic operations of nonfinancial corporation, where we have a nice clean data set.  So, I exclude financials, which are not central to the argument I will make here. And I exclude the overseas operations of all US corporations, because of data constraints.  This leaves me looking at 73% of total global pre-tax profits as of the first quarter.

Source: BEA, FH calculations
Data are actual to Q1.

Before I turn to the data, which I will rip through quickly, let me mention two ways I adjust the data before even getting into technical issues central to this note.  First, I adjust the headline profit data to net out the distortion caused by the swing in net indirect taxes occasioned by subsidies related to the Covid shock. To do that, I run a counterfactual in which the net indirect taxes are held constant as a ratio to gross value added for all periods after 2019 Q4. That has little effect on the measured level of profits as of Q1 because the net indirect tax rate has almost full renormalized, as you can see from the chart above. But it affects the path, shaving off the peak and making the cyclical profit decline a more recent development. I call this adjusted series “headline” because I want to focus on other adjustments and don’t want to refer to adjusted. 

Second, when calculating various margins, I smooth out the volatility of nominal gross and net value added during 2020 by assuming a steady growth rate there between the fourth quarter of 2019 and the first quarter of 2020. This has no effect on the profit figures, but it makes the denominator in the various margins less noisy and more meaningful. 

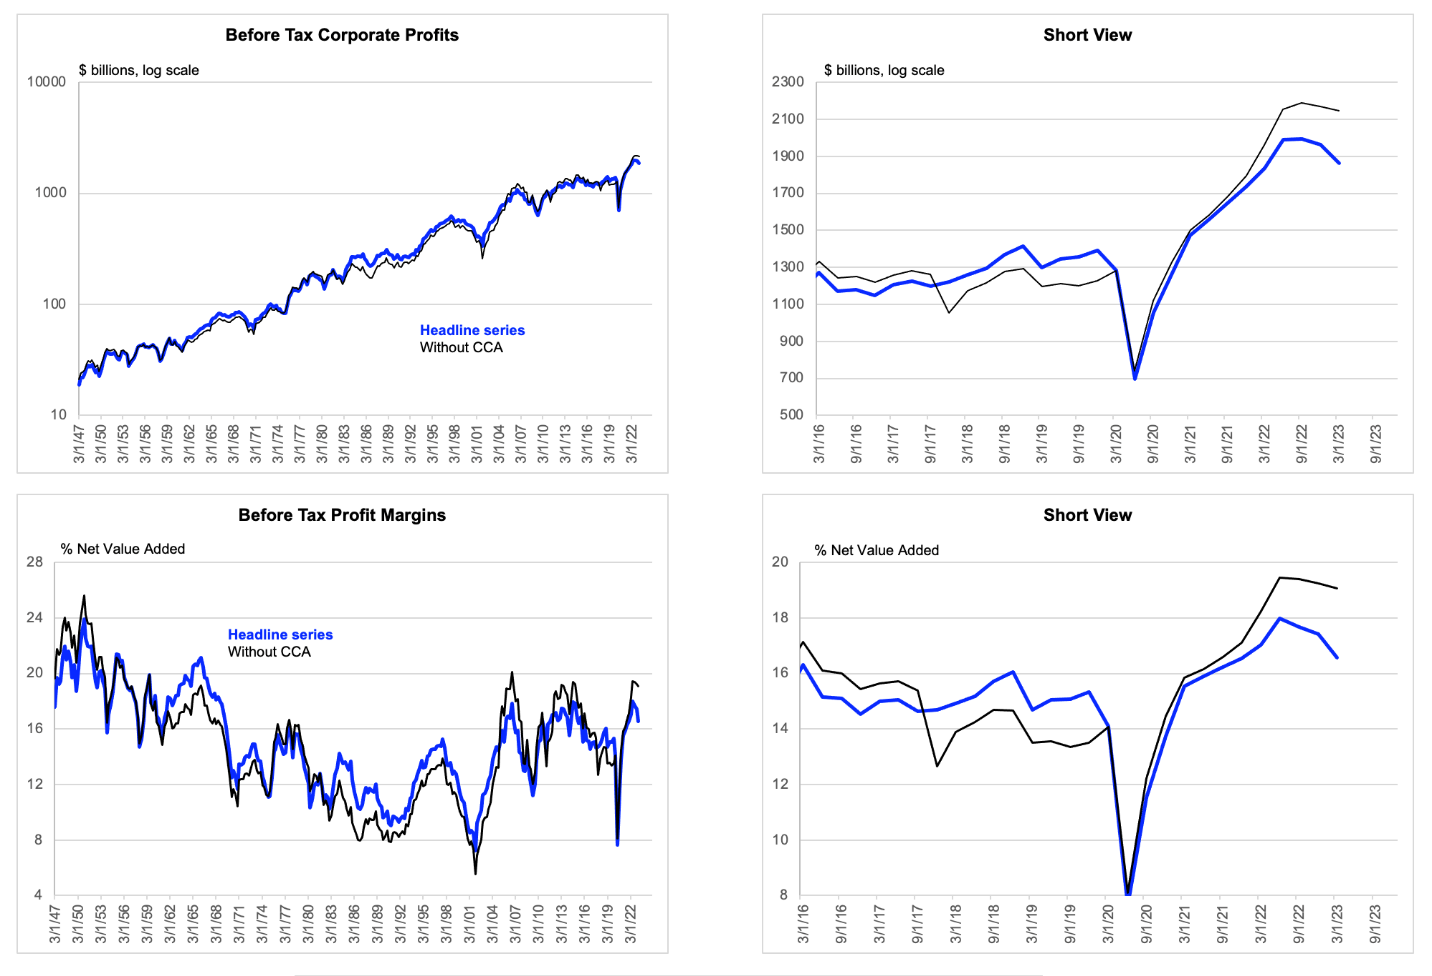
With that in mind, pretax profits are down 6 ½% (not annualized) during the past two quarters, but they are down only 2% if we exclude the influence of the CCA. So, this is obviously an important issue quantitatively.
A picture containing text, diagram, line, font

Description automatically generated
Source: BEA, FH calculations
Data are actual to Q1.

But why would we exclude the CCA, unless we are really just interested in cash flow, which is a separate discussion? Nominal value added in the corporate sector has been lifted by the steep rise of the general price level (i.e., inflation) during the past few years, so why would we not want to correct the (historical cost) nominal depreciation charges for that same inflation, as the CCA does, although admittedly imperfectly?  Note the bottom left panel of the chart above, that including the CCA in the profits calculation has led to a smaller overshoot at recent business cycle peaks and that the CCA exclusive measure of margins has collapsed to the less volatile CCA inclusive measure on each of the most recent couple occasions. Why would we want to miss that? If anything, we would want to port this issue over the company level data. Are reported and operating earnings controlling for this issue properly or are they overstating earnings?
A picture containing text, plot, line, font

Description automatically generated
Source: BEA, FH calculations
Data are actual to Q1.

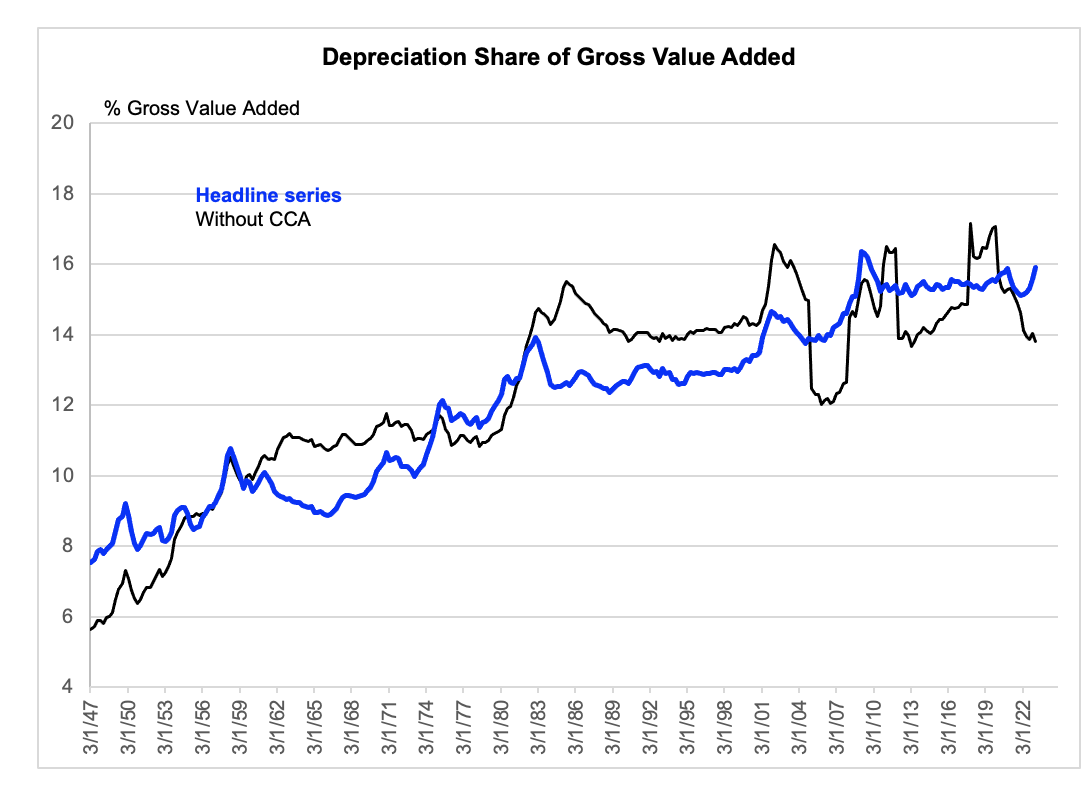
Or just look at deprecation charges, measured as a “margin” to gross value added with and without the CCA, as in the chart above. The CCA inclusive measure is less noisy and more intuitively sensible because it is, well, the more accurate measure. Depreciation charges have an upward trend, because of shortening capital lives related to tech advance, and they tend to rise above trend late in the cycle.  The correct data reflect that, while the wrong data do not. 
A picture containing text, font, line, plot

Description automatically generated
Source: BEA, FH calculations
Data are actual to Q1.

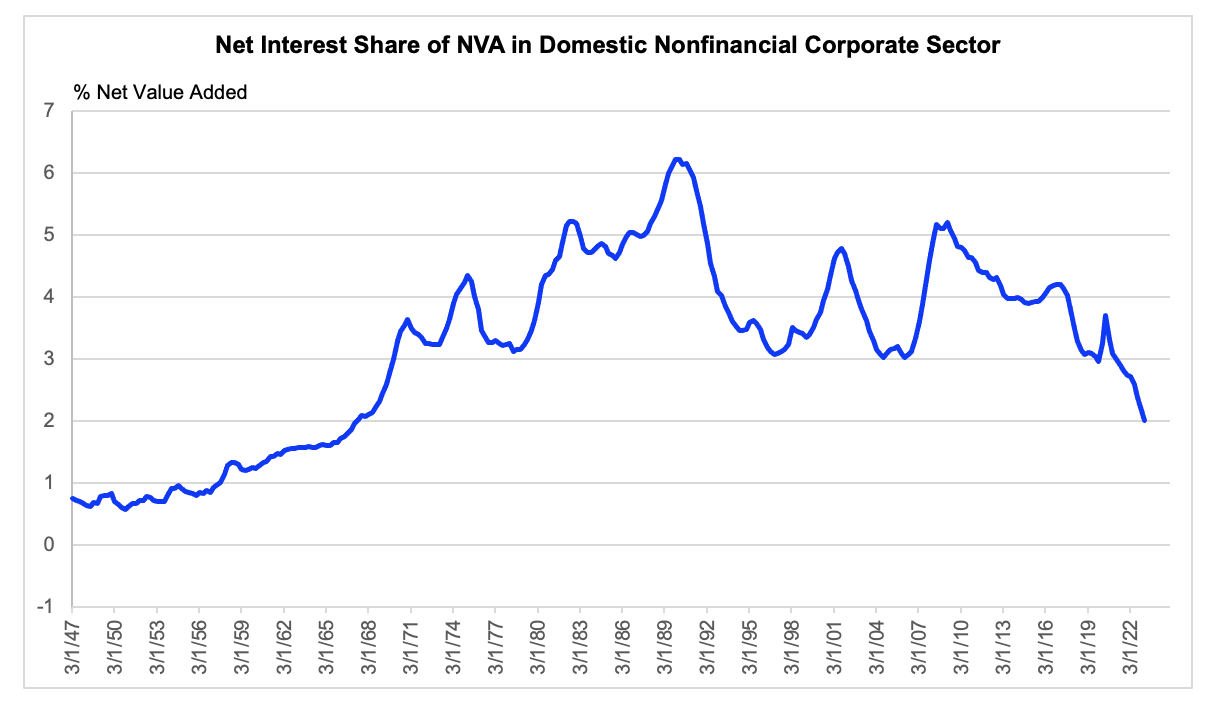
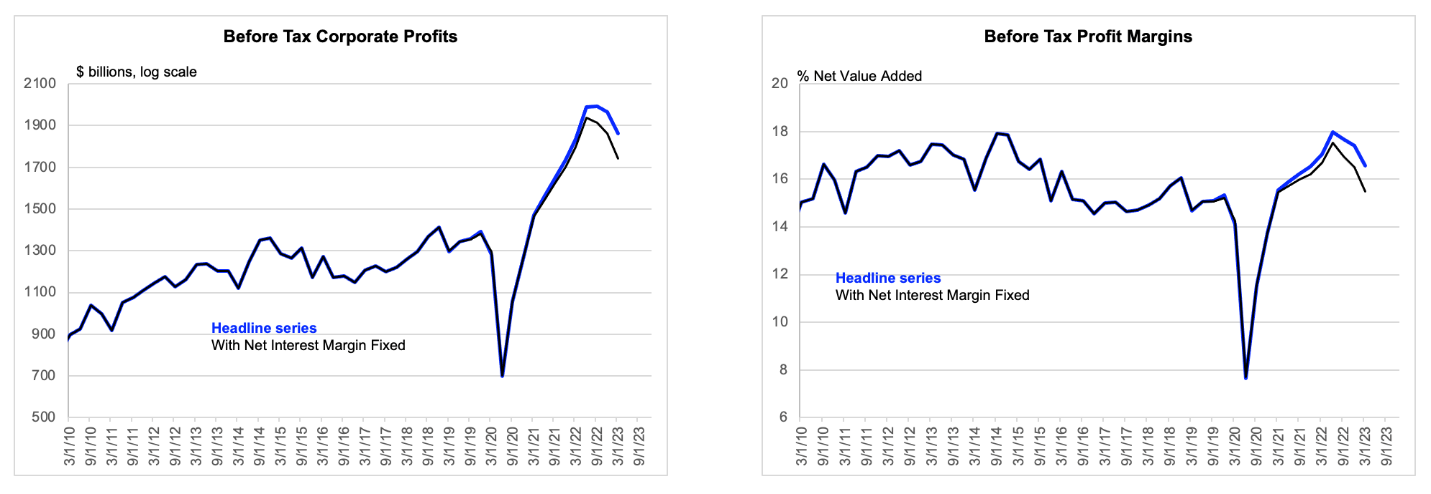
Finally, if we are going to nitpick the profit data, let’s do it properly!  The oddity in the National Accounts data is not the CCA, but the bizarre and seemingly unrelenting decline of the net interest margin, despite rapidly rising corporate debt (relative to value added) and the recent turn higher in interest rates. Let’s conservatively net that effect out by running a counterfactual in which the ratio of net interest to value added is held at its end 2018 level. That brings the profit decline over the past two quarters from 6 ½% to 9%. If anything, this likely understates the issue, because I am being conservative to make the point directionally reliable.  Barring a recession, which would be its own issue for profits, the net interest margin is fated to rise steeply. I am confused why it is not yet in the data, to be fair. 
A close-up of a graph

Description automatically generated with low confidence
Source: BEA, FH calculations
Data are actual to Q1.

Profits have been falling, which is hardly surprising, given the cyclical influences on them just now.  In fairness, stripping out the CCA is not as kooky as relating the discount rate in a t-bill with ten days to run to “default risk.” That bit of journalism sticks with ya!

DISCLOSURES AND DISCLAIMERS

Analyst Certification

The analyst, 22V Research Group, primarily responsible for the preparation of this research report attests to the following: (1) that the views and opinions rendered in this research report reflect his or her personal views about the subject companies or issuers; and (2) that no part of the research analyst’s compensation was, is, or will be directly related to the specific recommendations or views in this research report.

Analyst Certifications and Independence of Research.

Each of the 22V Research analysts whose names appear on the front page of this report hereby certify that all the views expressed in this Report accurately reflect our personal views about any and all of the subject securities or issuers and that no part of our compensation was, is, or will be, directly or indirectly, related to the specific recommendations or views of in this Report.

22V Research (the “Company”) is an independent research provider. The Company is not a member of the FINRA or the SIPC and is not a registered broker dealer or investment adviser. 22V Research has no other regulated or unregulated business activities which conflict with its provision of independent research.

22V Research, LLC is a professional services and independent publication organization. 22V Research, LLC is not a securities broker-dealer, not a member of the Financial Industry Regulatory Authority (FINRA), not a registered investment advisor (RIA) and not a member of SIPC.

Securities transactions, when offered, are offered by 22V Securities, LLC through LPS Capital, LLC. Certain employees of 22V Securities, LLC are dually registered as securities representatives of LPS Capital, LLC or Analyst Hub Securities, LLC. 22V Securities, LPS Capital and Analyst Hub Securities are members FINRA, SIPC.

https://brokercheck.finra.org/

Current Ratings Definition.

SECTOR OUTPERFORM: An “outperform” rating anticipates the company will outperform the S&P Regional Banking Index (peer group).

SECTOR PERFORM: A “market perform” rating anticipates the company will perform in line with the S&P Regional Banking Index (peer group).

SECTOR UNDERPERFORM: An “underperform” rating anticipates the company will underperform the S&P Regional Banking Index (peer group).

Limitation Of Research And Information.

This Report has been prepared for distribution to only qualified institutional or professional clients of 22V Research Group. The contents of this Report represent the views, opinions, and analyses of its authors. The information contained herein does not constitute financial, legal, tax or any other advice. All third-party data presented herein were obtained from publicly available sources which are believed to be reliable; however, the Company makes no warranty, express or implied, concerning the accuracy or completeness of such information. In no event shall the Company be responsible or liable for the correctness of, or update to, any such material or for any damage or lost opportunities resulting from use of this data. Nothing contained in this Report or any distribution by the Company should be construed as any offer to sell, or any solicitation of an offer to buy, any security or investment. Any research or other material received should not be construed as individualized investment advice. Investment decisions should be made as part of an overall portfolio strategy and you should consult with a professional financial advisor, legal and tax advisor prior to making any investment decision. 22V Research Group shall not be liable for any direct or indirect, incidental or consequential loss or damage (including loss of profits, revenue or goodwill) arising from any investment decisions based on information or research obtained from 22V Research Group.

Reproduction And Distribution Strictly Prohibited.

No user of this Report may reproduce, modify, copy, distribute, sell, resell, transmit, transfer, license, assign or publish the Report itself or any information contained therein. Notwithstanding the foregoing, clients with access to working models are permitted to alter or modify the information contained therein, provided that it is solely for such client’s own use. This Report is not intended to be available or distributed for any purpose that would be deemed unlawful or otherwise prohibited by any local, state, national or international laws or regulations or would otherwise subject the Company to registration or regulation of any kind within such jurisdiction.

Copyrights, Trademarks, Intellectual Property.

22V Research Group, and any logos or marks included in this Report are proprietary materials. The use of such terms and logos and marks without the express written consent of 22V Research Group is strictly prohibited. The copyright in the pages or in the screens of the Report, and in the information and material therein, is proprietary material owned by 22V Research Group unless otherwise indicated. The unauthorized use of any material on this Report may violate numerous statutes, regulations and laws, including, but not limited to, copyright, trademark, trade secret or patent laws.
