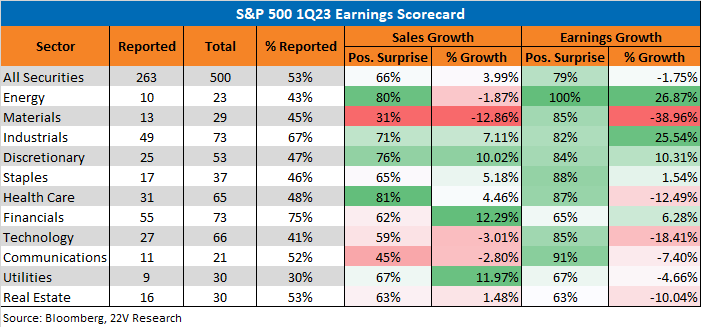
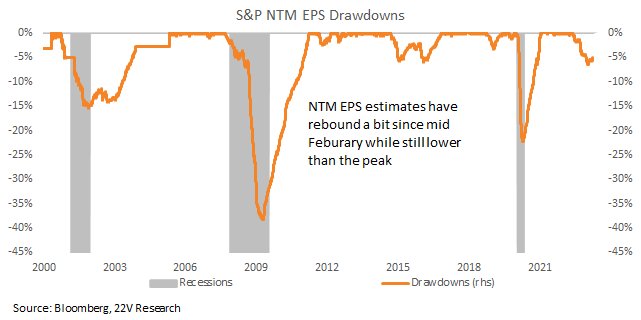
More than half of the S&P has reported 1Q earnings. At the index level, sales growth remains positive (+4% y/y), while earnings growth is negative (y/y and q/q) relative to 1Q22. Investors and consensus expectations towards earnings dropped ahead of 1Q, lowering the bar actual earnings need to clear. Those estimates have proven too pessimistic, but earnings are still tracking a decline y/y. NTM EPS dropped -6.5% relative to their mid-February peak but have rebounded to -5.1%. The forward looking (NTM) EPS bottom is likely past UNLESS the economy falls into a deep recession.
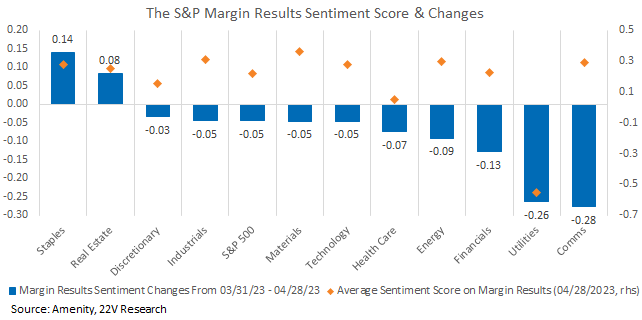
Weakening profitability is still the big issue for earnings. Management views towards margins fell in April, sentiment toward current margins. Nearly every sector has seen margin results sentiment fall. In line with margin results sentiment, Communications actual earnings margins have dropped the most over the past quarter. There is no broad market segment where investors can hide from margin pressures. That broad based weakness contributes to increased dispersion as company level fundamentals diverge and macro influence, though still high, wanes.
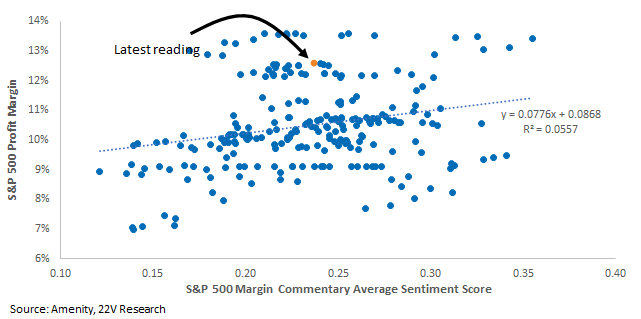
Historically, earnings margins have been positively correlated with margin sentiment. Trailing profitability is still high relative to history, even after dropping -1.1% to 12.5% over the past year. The rapid decline in actual and forward-looking measures confirms the ongoing margin pressures we would expect at this phase of the cycle. We don’t expect a collapse in profitability, just a steady weakening of margins.

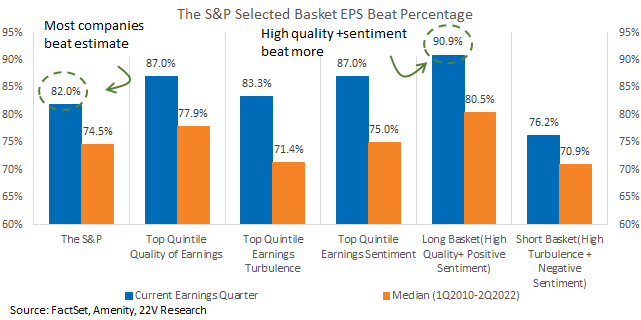
Sales and EPS beat rates have been higher than normal this quarter (EPS beat rate 82% currently) and of the names beating, most are doing so by 5% or more. 91% of our favored names, which have high quality and positive earnings sentiment, have beat EPS estimates. Our short side, which contains names with more earnings risk, have posted a 76% beat rate (lower than our long basket and the overall market).
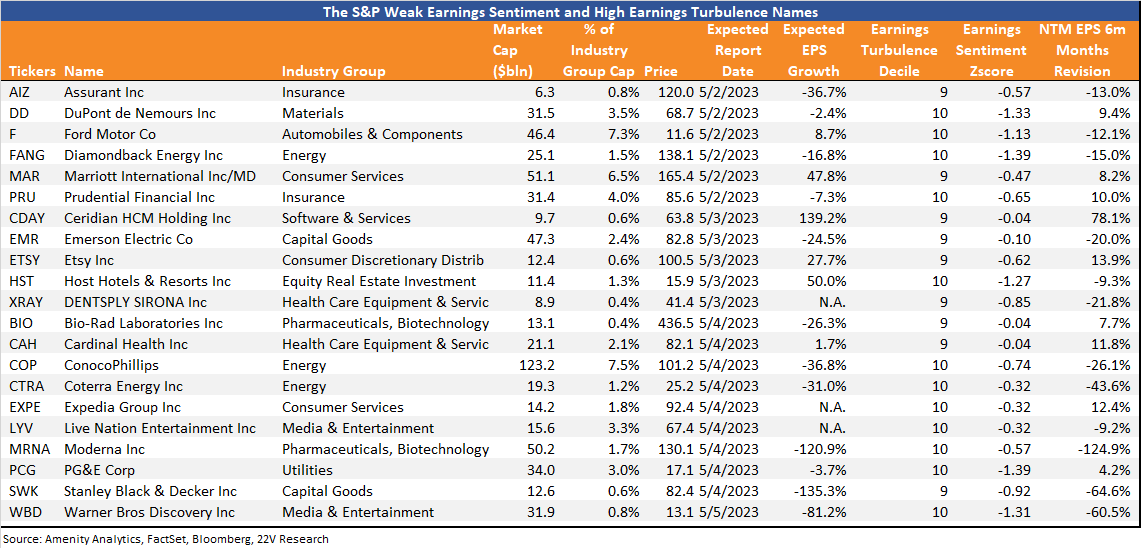
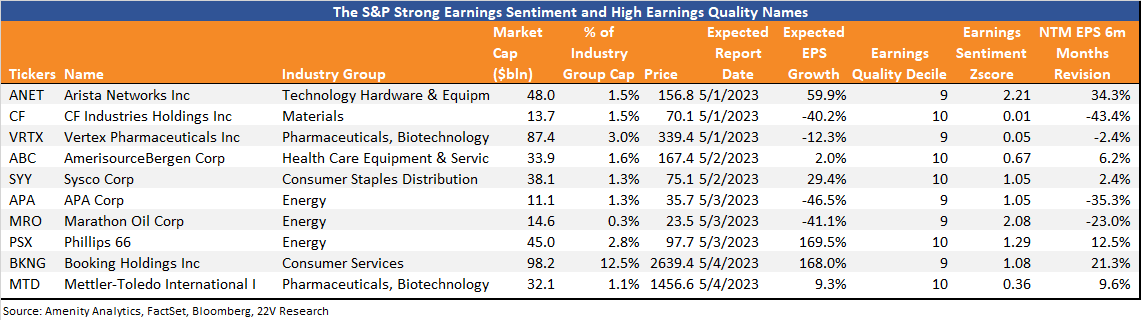
There are 162 S&P names reporting earnings next week. At the end of the report, we list the names reporting that fall into our long basket (strong quality and earnings sentiment scores), and names in the short basket (high earnings volatility and weak earnings sentiment).
Downward Risk to Margins: More than half of the S&P has reported 1Q earnings. At the index level, Sales growth remains positive (+4% y/y), while earnings growth is negative (y/y and q/q) relative to 1Q22. The biggest drag on earnings comes more from Materials, Technology, and Health Care. Most Defensives, except Staples, have also posted negative earnings growth.
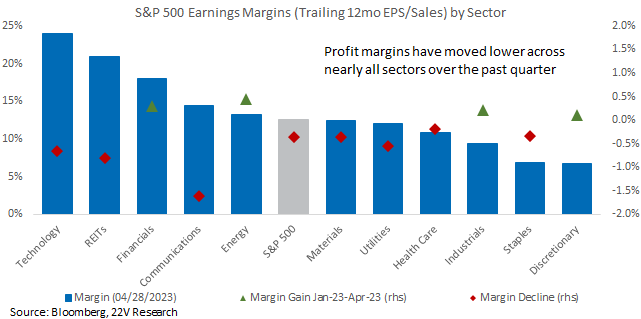
Corporate profitability faces increasing pressure as the economy slows and disinflation takes hold. Realized earnings margin have fallen at the index level and across nearly all S&P sectors relative to a quarter ago. The exceptions have been Financials, Energy, Industrials, and Discretionary. Financials margins have improved as companies have released earnings, and its relative stability is consistent with easing concerns around bank failures and broad credit losses. But trailing earnings can tell us only so much about the state of corporate earnings.
For insights beyond the number and forward-looking insights, we focus on sentiment analysis, powered by the Amenity natural language processing tool. Margin result sentiment – management views about current profitability – has plunged (82nd %til decline) and forward-looking margin commentary has moved lower. Those trends reflect how slowed economic growth and lower inflation are putting downward pressure on S&P margins, which is in line with the actual margin changes over the past quarter as well.
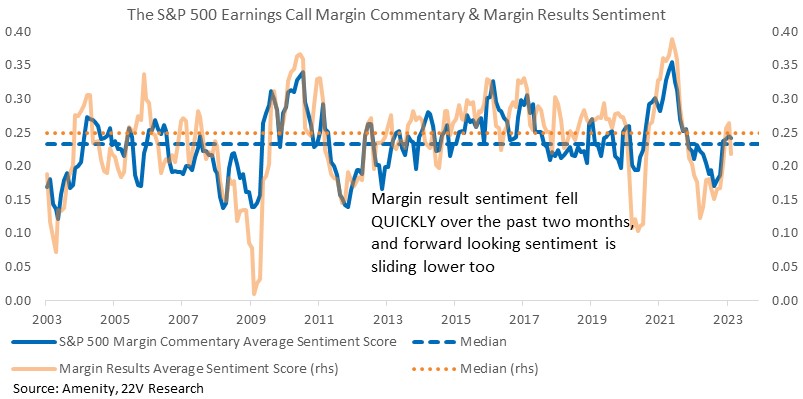
At the sector level, the major margin drags are Communications and Utilities. In line with margin results sentiment, Communication earnings margins fell the most over the past quarter as well. Most sectors saw margin results sentiment fall except Staples and REITs.
Historically, earnings margins have been positively correlated with margin sentiment. Trailing profitability is still high relative to history, even after dropping -1.1% to 12.5% over the past year. The rapid decline in actual and forward-looking measures confirms the ongoing margin pressures we would expect at this phase of the cycle. Growth has stabilized and trend inflation remains firm, so we don’t expect a collapse in profitability. Just a steady weakening of margins.
Long-Term Comment + Screening for Increased/Decreased Beat Rates: Sales and EPS beat rates have been higher than normal this quarter (EPS beat rate 82% currently) and of the names beating, most are doing so by 5% or more. 91% of our favored names, which have high quality and positive earnings sentiment, have beat EPS estimates. Our short side, which contains names with more earnings risk, have posted a 76% beat rate (lower than our long basket and the overall market).
Keep in mind, better than expected EPS does not suggest earnings are improving on an absolute basis. Investors and consensus expectations towards earnings dropped ahead of 1Q, leading to low bar for actual earnings to clear. Those estimates have proven too pessimistic, but earnings are still tracking a decline y/y. NTM EPS dropped -6.5% relative to their mid-February peak and have rebounded since to -5.1%. Given better than expected 1Q earnings reported, a sharp further drawdown for NTM EPS becomes less likely. The near-term fundamental bottom is likely past UNLESS the economy falls into a deep recession.
Next week 162 S&P companies are expected to report earnings, accounting for 33% of the index market cap. Below, we list the stocks names publishing 1Q earnings next week with high Earnings Quality scores and positive earnings sentiment. These are the names that make up our long basket during reporting season. The goal of this list is to reduce the risk of earnings misses, and it has work very well historically.
Below are the companies with high Earnings Turbulence scores and negative earnings sentiment. This is our higher earnings risk shot basket. The names falling in the basket are more likely to miss estimate than the index. And so far during reporting, companies missing estimates have been underperformed and by a wider margin than normal.