Strategy Weekly: The first part of this report explains how the S&P has climbed to 4150 despite a laundry list of investor concerns. The second part details the headwinds to climbing higher from here. I’m particularly passionate about today’s note. Hope you read it.
How We Got Here – Investors Started the Year Bearish and Are Still Bearish: Investors we survey have 83% odds of a recession (started the year at 91% odds) and we are roughly 50/50 on recession 6+ months forward. Within 3 months, recession/sharp earnings deterioration risk is at very low levels. Investors pulled forward recession risk, reflected in a deep discount in risk-on factors (like Earnings Turbulence) vs. risk-off factors and Cyclicals relative to Defensives. Low Vol factors and Defensive have been poor performers YTD. Sentiment/positioning hasn’t improved much though. 62% of investors still favor Quality (HERE) and preference for Defensives over Cyclicals. Near record short positioning in S&P futures, consistent outflows from ETF/mutual funds, and the deeply negative AAII bull bear ratio relative to economic data reflect the high near-term recession risk and bearish sentiment. FYI: typically, when sentiment is as weak as it is today relative to the economic data, 1/3/6 months S&P returns are stronger than normal.
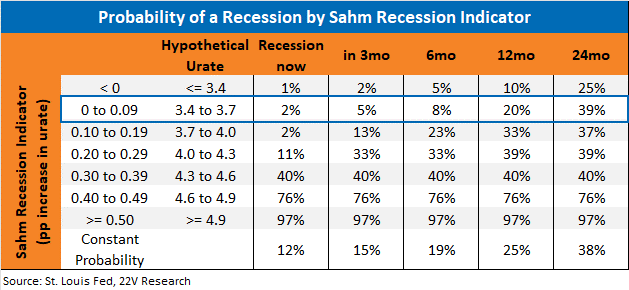
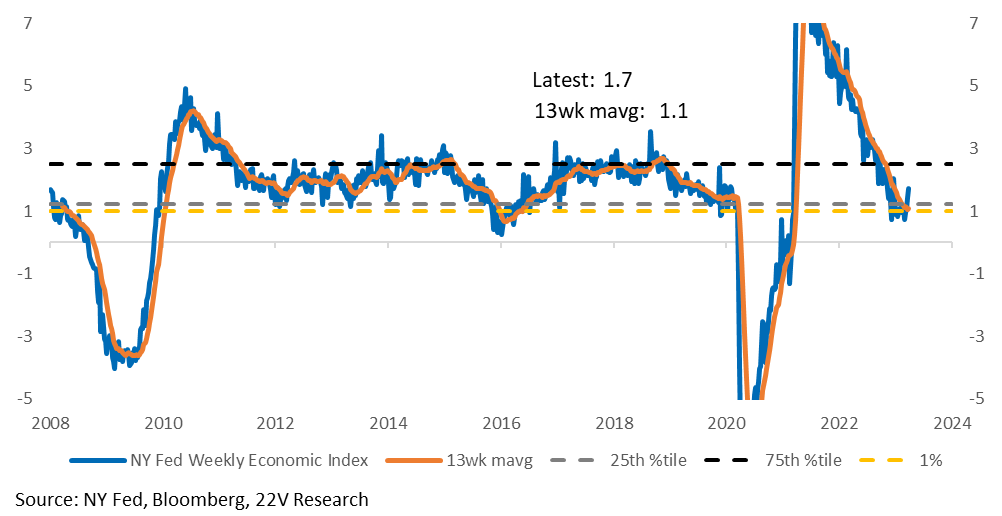
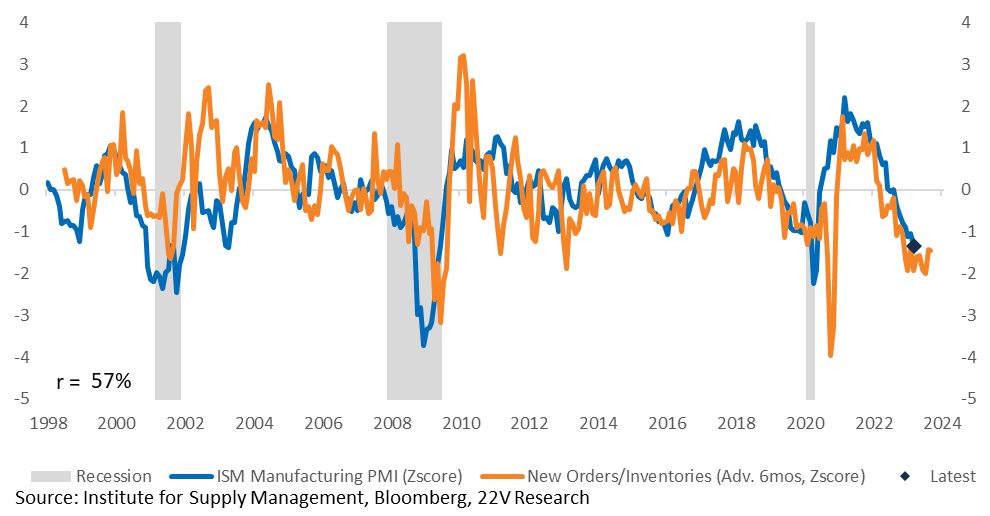
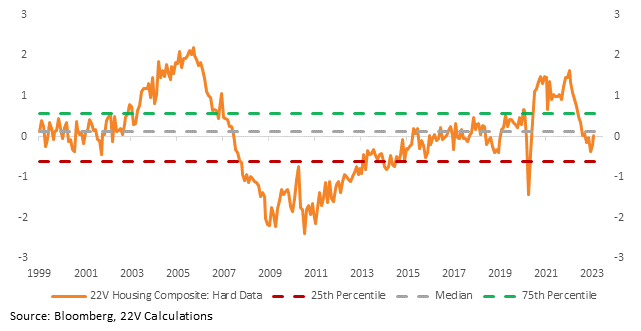
We have much lower NEAR TERM recession risk (within 3 months) because recessions developing over such a narrow window are rare. Also, evidence suggests the economy, although slowing, is still ok. The NY Fed Weekly Economic index has improved since the bank crisis and suggests 1.5% underlying demand growth, the Atlanta Fed GDPNow is at 2.6% for 1Q (~6%ish nominal), the unemployment rate remains at a level that suggests extremely low current recession risk (2%) and over the next 12 months (20%), and most of the drag from housing and the ISM is behind us. In talking to investors, it seems underappreciated that unless consumption slows aggressively (savings rates move much higher), the ISM drag on the economy is likely to fade. And the drag from housing is already easing. New orders to inventories in the ISM have stabilized and hard housing data points have hooked up recently. Housing and the ISM are NOT going to rocket higher, but their DRAG is fading. Mechanically, that lowers recession risk. The retail sales number last Friday were better than expected, payroll data was firm, unemployment claims were fine, and the high level of retail sales is a reminder that demand is hardly collapsing.
Summing it up. Investors have been too bearish as earnings/econ growth have been consistently better than expected, and the Fed is not in panic mode anymore (inflation has rolled over). Financial conditions stabilized, markets have gone up, and Cyclicals have led despite a bank panic in between. Understanding how bearish investors are and the fact that they were pulling forward recession risk too quickly has served us well for the past 8 months. Understanding sentiment has been important.
The Problem – Inflation Is Not Slowing Enough as We Reach the High End of Our Fair Value Range: IG, HY, senior CDS, and Subordinate CDS, all narrowed last week. The easing of credit conditions is consistent with another decline in the Fed’s balance sheet. Deposits and bank credit, including loans and leases of which C&I loans are most important, were up overall and at small banks. The emergency measures from the Fed have worked and are consistent with early reporting from banks. A sharp tightening in lending conditions is not obvious. Not yet at least. If lending conditions are not going to tighten as much as the Fed thinks, the Fed must do more to slow demand growth. That is why yields are going back up.
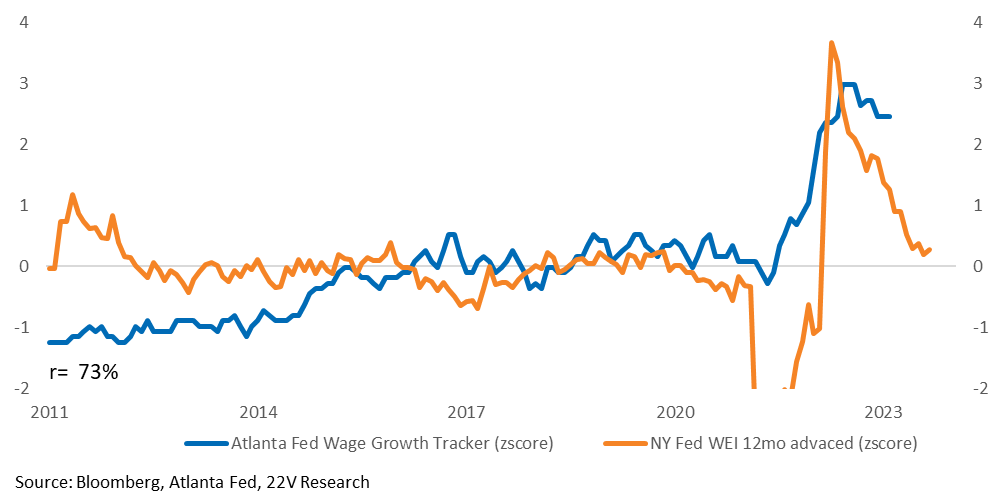
Following the payroll data, the odds of soft landing increased. That was largely because average hourly earnings growth declined while headline employment gains remained solid. That implies lower inflation with still solid growth. Great Combo. Or so, we thought. Since the payroll report, it has been pointed out by a few economists (Gerard’s note HERE), that wage growth was likely biased to lower and actual trend growth is still too hot for the Fed. The Atlanta Fed’s wage growth measure hooked back up last month. Core CPI print ex rents (CPI was not dovish) only confirms the idea that wages are still running too hot.
Wages are running too hot for the Fed despite an economy that has slowed and will slow further. Again, near term recession risk is low, but the Fed’s owns staff is forecasting an aggressive slowdown in economic growth in 3Q/4Q, AND the Fed is maintaining that they need to do more to slow economic growth. Has that ever happened before? Bottom line, the Fed is comfortable that economic growth will slow significantly, yet they are hesitant to signal policy may ease. It is this hawkish objective that matters more than their actual forecast. Don’t get caught up in how many rate hikes there will be. It’s the objective that matters.
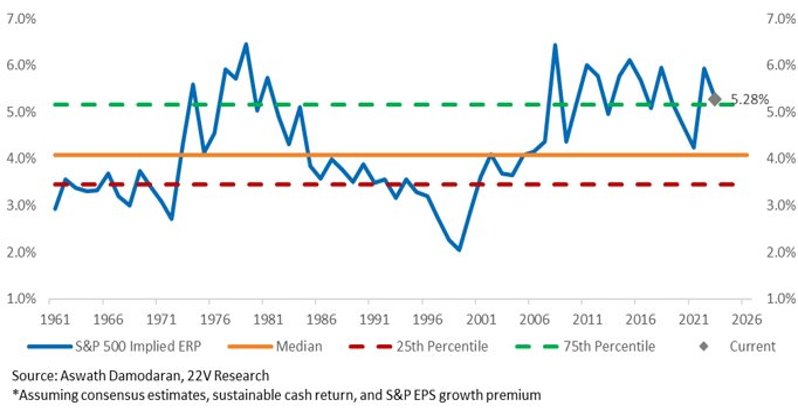
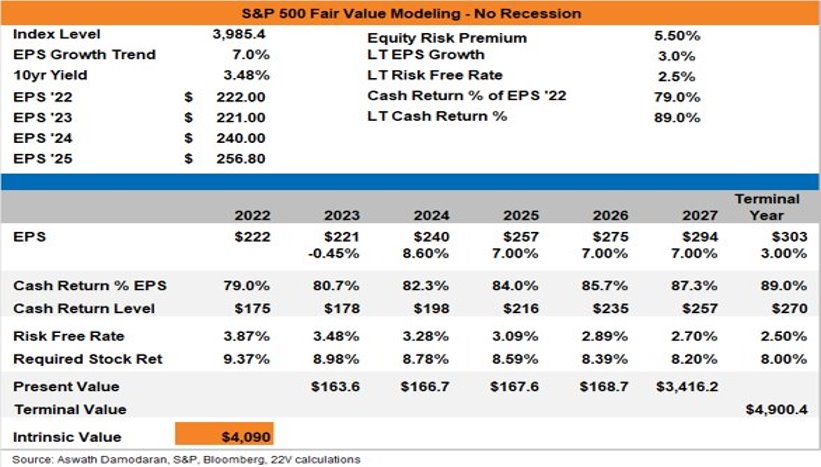
Fair Value & The Current Economic/Fed Reaction Function Backdrop: The Implied ERP calculation we use, based on NYU Stern School Professor Aswath Damodaran method, is based on an expected earnings path, risk free rate (10yr), cash return (historical comp), and equity risk premium (excess return investors are demanding for taking risk). Bottom line, the ERP is in the middle of its post-GFC range. If the Fed needs to keep FCI tight and recession risk remains elevated the ERP is unlikely to move lower from here. Assuming $220 in EPS in 2023, which is higher than buyside consensus, and current 10yr yields, fair value is 4,100ish. Our range remains 3800-4200 and given inflation dynamics, what the Fed reaction function seems to be, and current wage trends (too hot). So, it is hard to chase the market here. We still have a bias for Cyclicals, but with lower conviction. We would be more bearish if sentiment was not so negative.
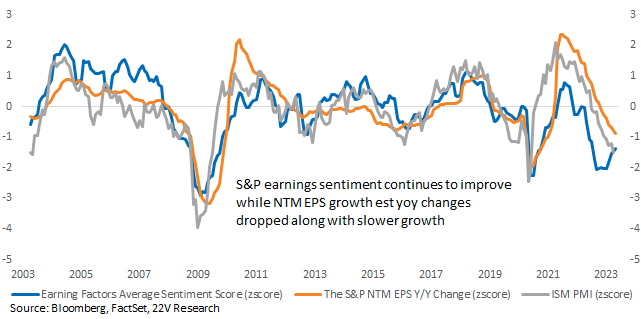
Earnings Preview/Lower Correlations: Management sentiment toward earnings, measured using the Amenity natural language processing tool, suggests firming fundamentals. Albeit, at weaker overall levels. The stabilization in earnings sentiment generally coincides with the YoY in S&P EPS and ISM stabilizing. That is good news relative to recession fears, it DOES NOT indicate a sharp acceleration in earnings. It is consistent with the economy growing at a below trend pace (not recession). Which the Fed wants. More return dispersion remains one of our favorite themes of 2023 and is particularly important as we move through earnings season with the S&P at the high end of our fair value range. Stocks the benefit from lower correlations should outperform. Happy to send the list.
Charts & Such below…
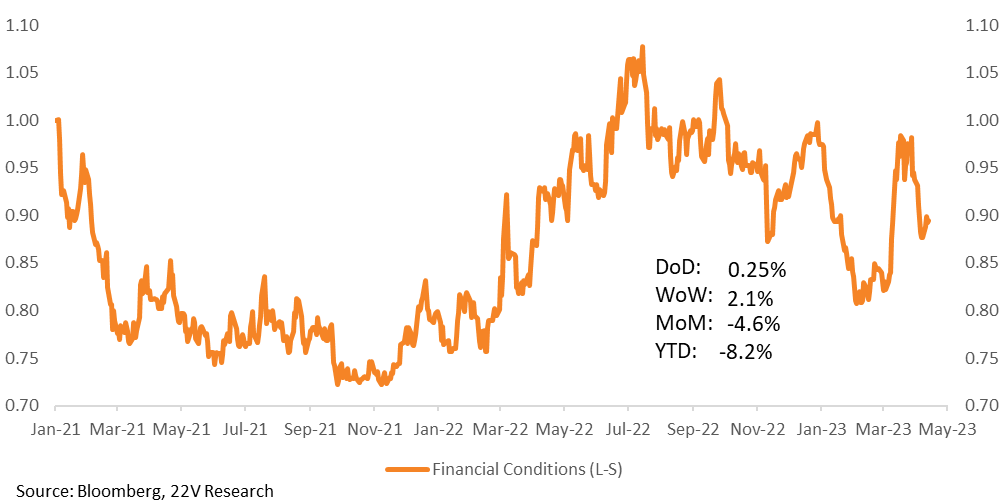
Indicators: A Fed staff that is forecasting a recession in the back half of ‘23, but a Fed that is still being careful to keep the idea of a further increase of the funds rate – and no quick cuts – front and center in our minds is what led us to pull forward the timing of a potential recession. Much can change in 6+ months, which is why we have faded recession positioning now, but if the current Fed forecast for the economy/Fed reaction function played out, financial conditions would tighten. For now, stocks that benefit from tighter financial conditions have underperformed significantly MoM.
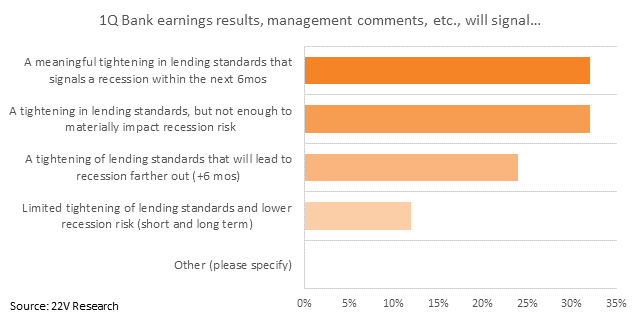
According to the 22V investor survey (HERE), the majority of investors think 1Q bank earnings results/commentary will 1) show either a meaningful tightening in lending standards that signals a recession within the next 6 months, or 2) a tightening in lending standards that leads to recession 6+ months out. On net, 56% think tightening of lending standards leads to a recession. To be fair, a tightening of lending standards that will not be enough to materially impact recession risk was the second choice. Not many respondents (12%) think there is only a limited tightening of lending standards. So far, the worst fears are not playing out.
According to the Sahm rule the unemployment rate suggests low recession risk now and over the next 24 months. That can change if the Fed continues to push the unemployment rate higher. Or the banking crisis pushes the unemployment rate higher as lending standards tighten. The Fed’s own forecasts assumes the Sahm rule gets triggered as the urate rises later this year and in 2024, which is why the market has struggled.
The strong labor market backdrop is coming along with an economy that appears to be growing around trend of ~1.8%. The New York Fed Weekly Economic Index (WEI), which attempts to measure “underlying demand” using investment, production, and consumption metrics (inventories and USD influence not a large factor like it is for GDP) increased from 1.43 to 1.71 last week. The 13wk mavg increased from 1.06 to 1.07. The labor market AND the BREADTH of economic indicators (looking beyond single indicators like the ISM) suggest ok demand and much stronger EPS growth than investors are predicting (investor EPS survey HERE).
The consumer side of the economy has been strong. As we noted after the personal consumption data, underlying PCE growth is around 3% in 1Q. That should slow a bit going forward, but unless consumption growth falls off a cliff, the drag from the manufacturing sector should fade. The ISM is not going to rocket higher (customer inventories are still high), but the drag on GDP growth is highly likely to fade. That mechanically will help GDP.
And the same goes for housing. As Gerard noted, the headwind to aggregate demand growth from housing is set to fade rapidly, beginning immediately (HERE). If housing is less of a drag, growth will be ok. Growth could be too strong, helping keep wages/core inflation at too high a level. For now, that is not an issue as wages hook over. Below is a chart of the hard housing data points and the ones that more directly impact demand metrics like GDP. They include Existing Home Sales, New Home Sales, Pending Home Sales, Housing Starts, Permits, Construction, Case-Shiller. Consistent with Gerard’s point, the data have stabilized.
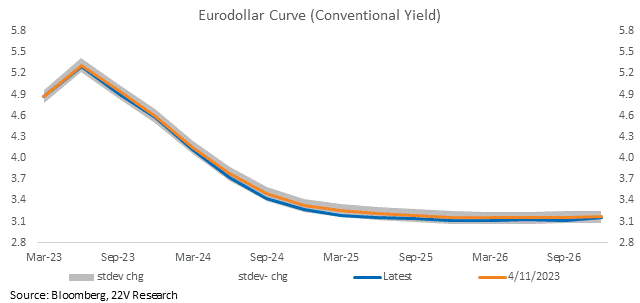
Expectations for rate cuts did not budge post CPI. Investors are still anticipating rate cuts starting in July despite little weakness in macro data. As an aside, we still think the Fed is more likely to leave rates high out of an effort to keep (gain) credibility. As Gerard puts it, “these guys assign a PR cost to changes of direction, which they believe make them look silly.” The Fed is unlikely to cut without economic weakness.
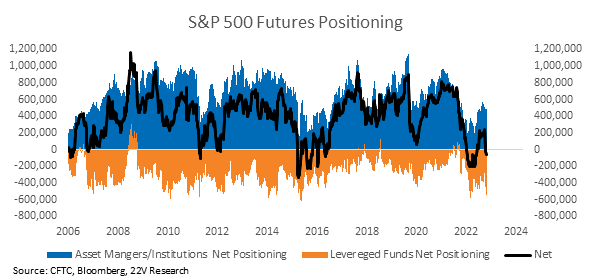
CFTC net positioning in S&P futures (filtered to include ONLY active money) is in its 5th percentile. This reading was pre-payrolls, but it would take a 100th percentile w/w move to get to the 25th percentile net reading. There’s a lot of cash on the sidelines waiting for a pullback.
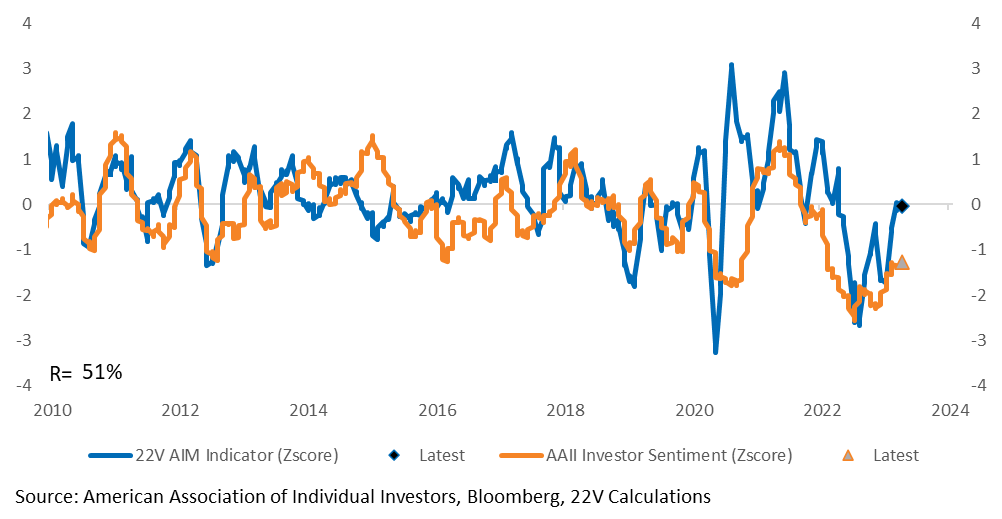
Below is a diffusion index of economic data (is the econ data point better or worse than the previous data point) relative to investor sentiment. Investors are positioned for weaker economic data.
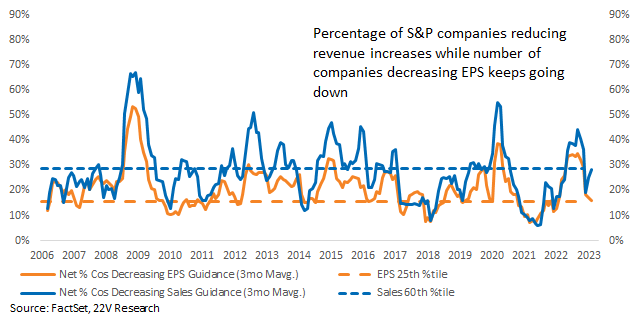
Quick Earnings Preview: We are more bullish on the economy vs a guaranteed recession, but growth has slowed, which is why sales growth has weakened. The risk is if it collapses and investors we survey seem to think it will. That would explain 83% of investors forecasting a recession and 207 on 2023 S&P EPS.
Management sentiment toward earnings, measured using the Amenity natural language processing tool, suggests firming fundamentals. Earnings guidance gains are in-line with improving earnings sentiment expressed by the management. In late-’22, earnings sentiment fell to recession levels, but it has been rebounding for the past two quarters. That improvement has occurred despite slowing NTM EPS momentum (y/y) and falling PMI readings. There have been sentiment head fakes in the past (sentiment improves but estimates remain in a downtrend), but generally sentiment firms AHEAD of a bottom in revisions.
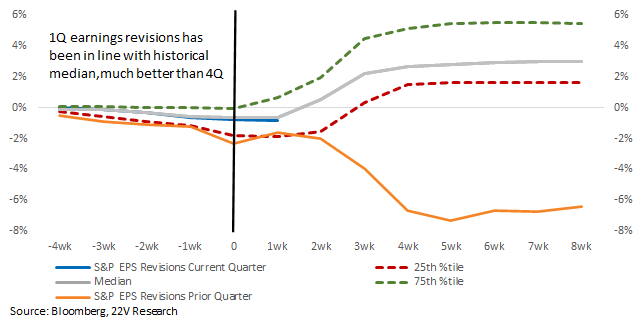
Near-term estimates revisions do not suggest a weak reporting season. Estimates revisions follow a predictable pattern; they are lower into the start of reporting, setting a lower bar. The result is the +70% index level beat rate seen most quarters. 1Q EPS estimate revisions have fallen -0.8%, roughly in line with historical norms. The market has moved away from the extreme pessimism heading into 4Q reporting, where revisions were in their 25th %tile and collapsed after reporting got started.
Important Chart: Below is the an important chart in monitoring a soft landing. It is the New York Fed Weekly Economic index vs Atlanta Fed’s wage growth measure. If demand growth holds up and wages continue to decline, the Fed doesn’t need to tighten more aggressively, and recession odds will move lower. If wages don’t come down the Fed has to tighten more (bad), which means demand growth would need to move even lower to get inflation down. Last week Atlanta Fed wage growth measure moved up. Not good.
Fair Value: The Implied ERP calculation we use is based on an expected earnings path, risk free rate (10yr), cash return (historical comp), and equity risk premium (excess return investors are demanding for taking risk). The ERP we prefer is Aswath Damodaran’s (more here). We prefer that equity risk premium as it accounts for dividends and net buybacks. Total cash return has become a large part of expected market returns.
Risk reward not great for overall market…our range is 3800-4200
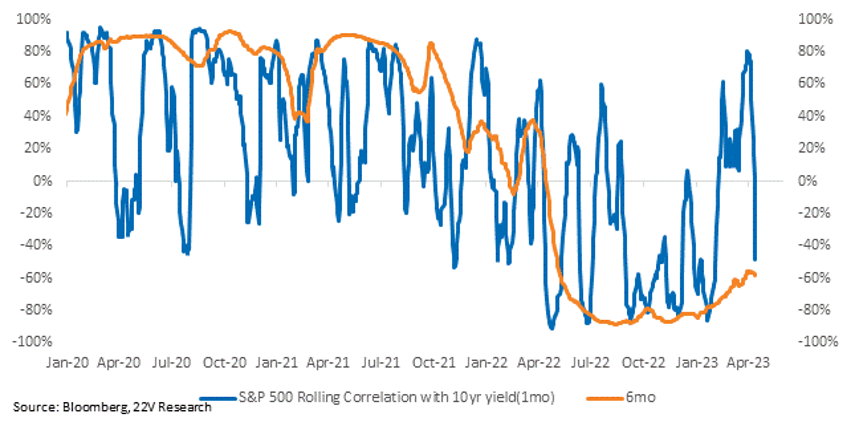
The 1mo rolling correlation between the 10yr yield and the SP has dropped just as the 6mo rolling correlation was starting to trend higher. If inflation remains at too high of a level, higher rates will be bad for S&P again.
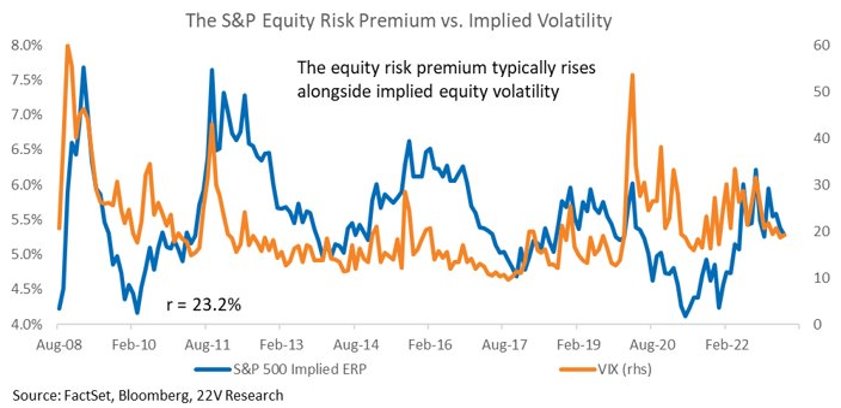
The Implied ERP has been positively correlated with implied equity volatility. That leaves the S&P fair value vulnerable near-term if equity vol moves higher (and catches up to Treasury vol). So far, the VIX has remained relatively stable, helping explain the limited impact of the bank failures on the broader equity market. Vol is unlikely headed lower from here given the Fed intent to slow economic growth.
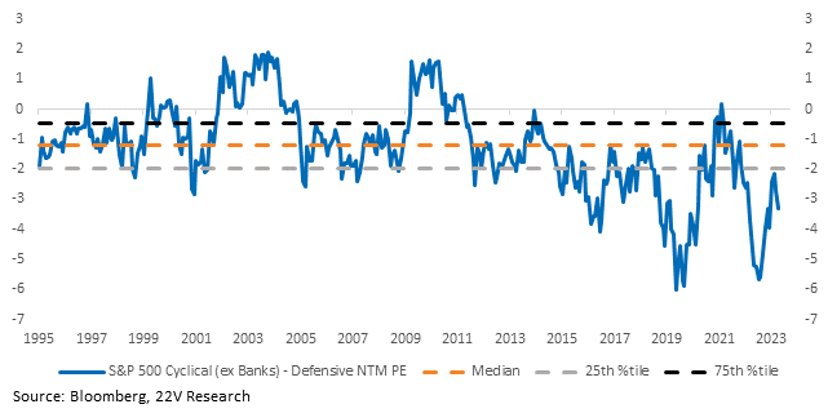
The spread between Cyclical and Defensive (ex-Banks) median NTM PEs is -3.23 (9th%tile)