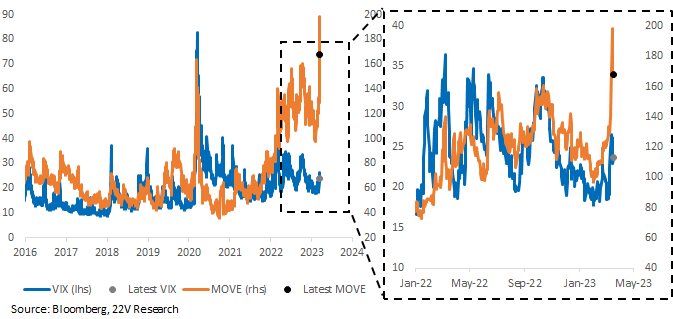
How much downside risk recent bank failures pose is far from settled as Credit Suisse and First Republic Bank continue to decline despite massive interventions. How much credit will be constrained is not observable in real time, but volatility has increased across asset classes. Fed funds futures is pricing in a 5.2% peak in June, followed by a series of rate cuts. Treasury volatility measured by the MOVE index reached its 99.5th %tile earlier this week. Implied equity vol indicates 1.6% daily S&P moves. High volatility is likely to remain in place until a clearer fed funds/economic path emerges, and that is going to take time.
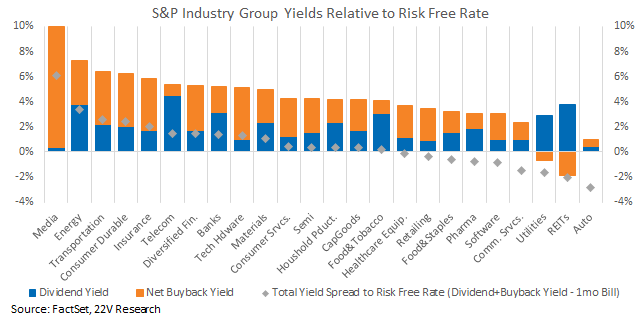
Higher volatility, declining earnings estimates, and increased uncertainty about the earnings outlook means stocks with higher cash return yields are potentially more attractive. Currently 9 out of 24 S&P industry groups have cash yields BELOW risk-free rates. Auto, REITs and Utilities have the lowest yields, and the rest of the groups are a mix of Defensives and Cyclicals. The inherently higher risk of equities combined with their low yields make those industry groups relatively unattractive, regardless of their broader classification (Cyclical, Defensive, etc.,).

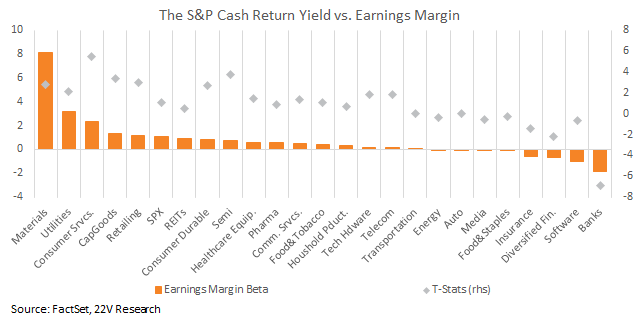
A regression between industry group level cash return yield changes and earnings margin changes indicates the two tend to move together. Materials and Utilities cash returns have the strongest positive correlation with margins. Weaker profitability means lower yields in those groups. Interestingly, cash return yields and margins are negatively correlated within Financials. Higher yields are not going to save Fins if the banking crisis deepens though.
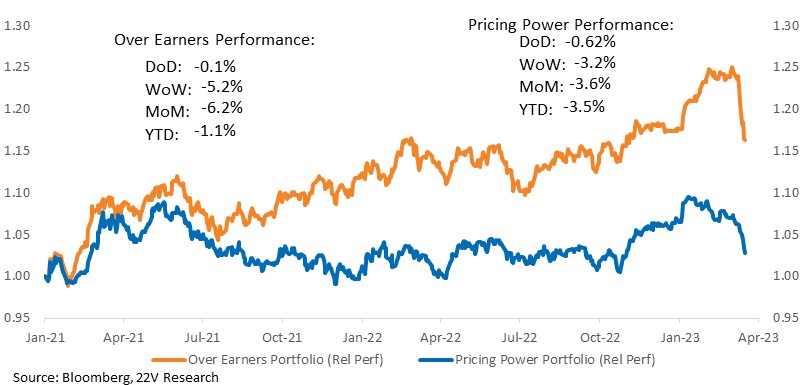
The above is another reason to focus on high margin sentiment companies (HERE) and to avoid Over Earners (companies that saw profits spike higher during the high inflation period). After a strong start to the year, Over Earners have collapsed over the past few weeks. Pricing power names have underperformed as well, but along with higher margin sentiment stocks, we would expect Pricing Power to perform better than Over Earners over the next several months at least.
Diverged Volatility on Industry Groups: How much downside risk recent bank failures pose is far from settled as Credit Suisse and First Republic Bank continue to decline despite massive interventions. How much credit will be constrained is not observable in real time, but volatility has increased across asset classes. Fed funds futures is pricing in a 5.2% peak in June, followed by a series of rate cuts. Treasury volatility measured by the MOVE index reached its 99.5th %tile earlier this week. Implied equity vol indicates 1.6% daily S&P moves. High volatility is likely to remain in place until a clearer fed funds/economic path emerges, and that is going to take time.
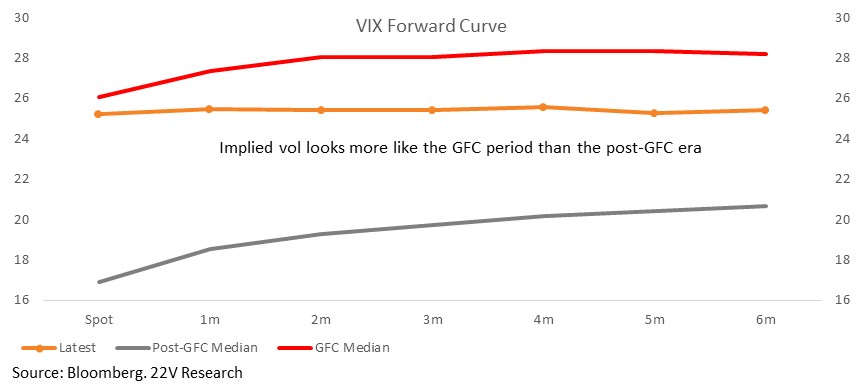
Implied equity volatility climbed sharply in March, and the VIX forward curve has been much higher than investors got used to during the post-GFC period. The current curve looks more like the financial crisis. The combination of high inflation and bank failures has not occurred since the 1970s, making how the macro backdrop will evolve from here even less certain than normal. That suggests volatility will remain high over the coming months.
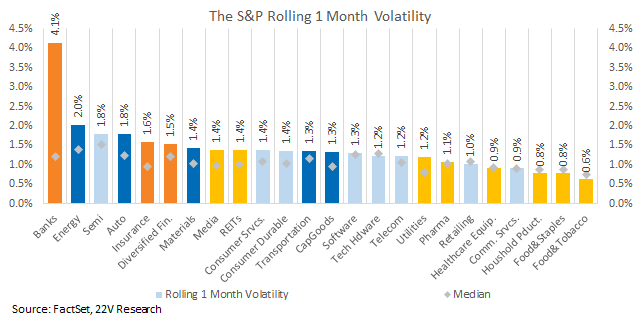
Unsurprisingly, at the industry group level, Banks have the highest short-term volatility readings today, far exceeding all other industry groups. Earnings of Banks face pressures from the rising funds rate and deeply inverted yield curve. Valuations are lower today than they were in the lead-up to the GFC (details HERE). That is a modest support, but Bank volatility is likely to remain higher than other industries near term. Thinking about the market more broadly, Deep Cyclical (highlighted in dark blue) returns are more volatile than Defensives (highlighted light yellow) returns and those of most Cyclicals (light blue, Tech in particular).
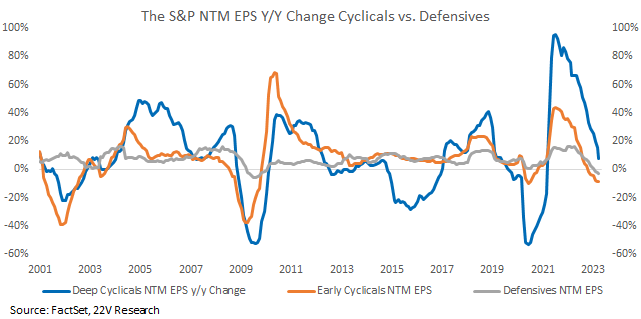
Return volatility is of broad market groups are consistent with their earnings drawdowns. Deep Cyclicals NTM EPS estimates have collapsed as growth has slowed. Defensives posted relative stable NTM EPS compared to other groups. That helps explain their lower return volatility as well.
Higher volatility, declining earnings estimates, and increased uncertainty about the earnings outlook means stocks with higher cash return yields are potentially more attractive. Currently 9 out of 24 S&P industry groups have cash yields BELOW risk free rates. Auto, REITs and Utilities have the lowest yields, and the rest of the groups are a mix of Defensives and Cyclicals. The inherently higher risk of equities combined with their low yields make those industry groups relatively unattractive, regardless of their broader classification (Cyclical, Defensive, etc.,).
A regression between industry group level cash return yield changes and earnings margin changes indicates the two tend to move together. Materials and Utilities cash returns have the strongest positive correlation with margins. Weaker profitability means lower yields in those groups. Interestingly, cash return yields and margins are negatively correlated within Financials. Higher yields are not going to save Fins if the banking crisis deepens though.
The above is another reason to focus on high margin sentiment companies (HERE) and to avoid Over Earners (companies that saw profits spike higher during the high inflation period). After a strong start to the year, Over Earners have collapsed over the past few weeks. Pricing power names have underperformed as well, but along with higher margin sentiment stocks, we would expect Pricing Power to perform better than Over Earners over the next several months at least.