Back Economics

Equity premium head scratcher

Published on October 9, 2026

∙ Download the PDF Report

By

Gerard MacDonell

I follow a crude measure of the equity premium that is defined as the centered-smoothed-earnings yield less the real yield offered in the 10-year Treasury note. It was helpful in keeping me generally constructive equities for about a decade after the GFC on the grounds that moderate economic growth was “good enough,” relative to what seemed to be priced. Over the past couple years, it has been less helpful because it has kept me from being enthusiastic about equities, although I don’t really do bearish or even out.

Right now, this simple metric is at its lowest level since the NASDAQ bubble in the late 1990s and early 2000s. It looks somewhat less depressed if we measure the risk-free rate excluding the (ACM) estimated term premium. However, this adjustment has little effect on the comparison with the bubble period because the estimated term premium now is about what it was then. It is just that it is no longer depressed.

I recall a colleague observing this simple metric and asking, “Why don’t you do it the right way?” By doing it the right way, he meant substituting out the idea that the earnings yields is the expected return, based on some dubious theoretical reductionism, and instead incorporate what the consensus actually expects for dividend growth and the terminal value of the market at the medium-term horizon at which expectations (and thus the index level) would be at some sort of equilibrium.

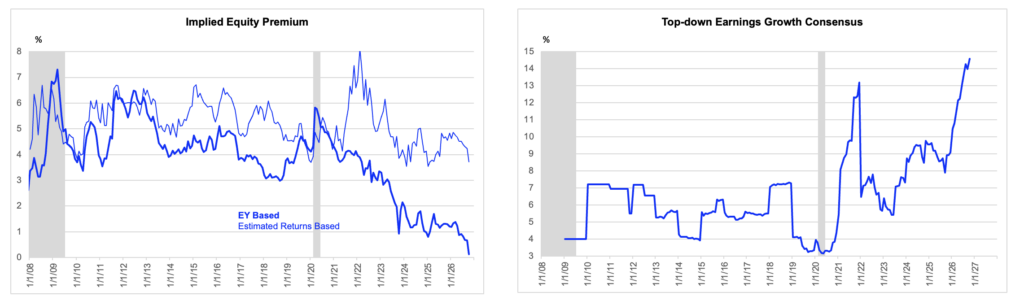
Equity valuation is unremarkable relative to 14% expected earning growth
Source: Federal Reserve Bank of St. Louis (FRED), Bloomberg, NBER, Dow Jones Indices, Ed Yardeni, Aswan Damodaran, Federal Reserve Bank of Philadelphia (for inflation expectations in conventional measure), FH calculations
Bond yield data are actual to yesterday’s close. Equity prices are not exactly aligned. Call them early October.

As you will know from the strategy team’s work, Aswath Damodaran, at the Stern School of NYU, does it “right” in the sense favored by my friend. He also has a somewhat unconventional measure of the cash flows generated by equities, which includes both dividends and buybacks. I hasten to add that he is very explicit that reasonable people may disagree on what the appropriate measure of the equity premium is, all the while rejecting nihilism on the point. And he seems to favor the mosaic approach in figuring out how much risk tolerance is in the market, by looking also at surveys and risk premia in other markets, such as bonds or real estate. My interest here is in pointing out what strikes me as an interesting quirk arising in his work, rather than in criticizing his work. I am not competent to do that.

Damodaran’s measure of the equity premium, which is developed in nominal space (with inflation canceling out of the algebra) remained higher for longer during the post-GFC recovery, which was clearly an advantage, one that reflected in part that expected earnings growth was higher than the EY-based approach implicitly assumed. But his measure and my simpler one were qualitatively in line. They both said a meh recovery was good enough. In the event, we got a surprisingly great recovery of profits even in a meh economy, but that is a separate discussion.

Quite recently, though, his measure of the equity premium has utterly refused to fall, despite a huge rise in bond yields and little change in earnings yields as conventionally measured. And the reason seems obvious. The consensus top-down measure of earnings growth over the next five years has exploded to a record high, although his monthly data go back less than two decades.*

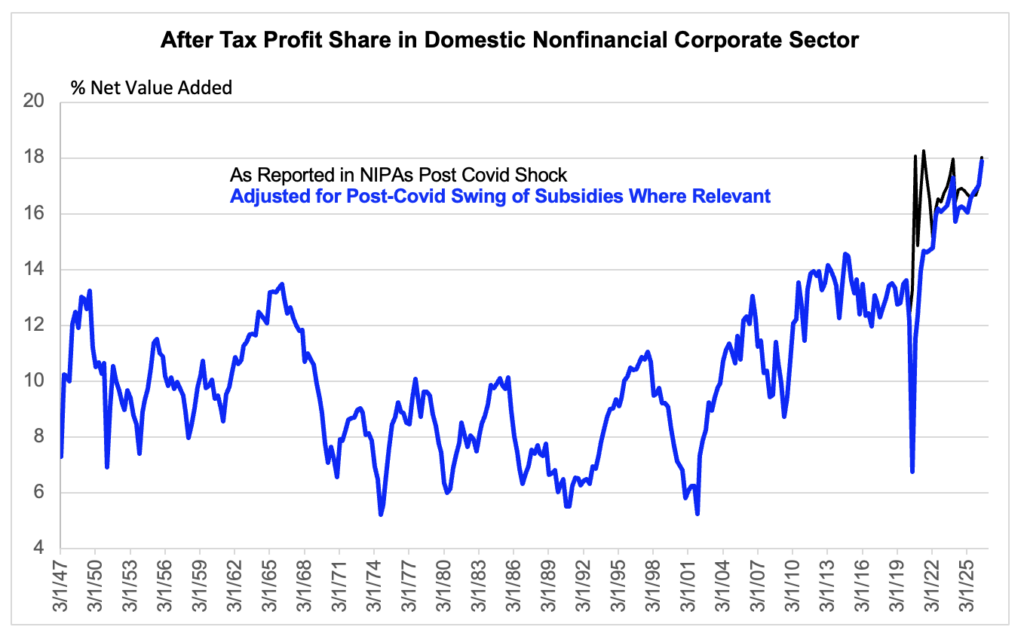
Obviously, the explosive growth of earnings in recent years needed to be factored into equity strategy in real time. If earnings are soaring, it might seem a bit churlish to point out that the earnings yield looks kind of low relative to the bond yield. Totally fair point. However, it is striking that earnings growth estimates are so high with profit margins already at all time record wides. I have long been a skeptic of the notion of margin mean reversion. Graveyards, as they say, are full of fans of that. But just for fun, confirmation of the consensus earnings growth rate in a world of 5% nominal value added growth would take the record-high profit margin in the domestic nonfinancial corporate sector to 27% within five years. I am not sure what to do with that, but it does seem relevant.

* He has annual data going back to 1960, and his latest monthly observation, for October 2026, is far higher than any of those annual figures.

Consensus implicitly expects aggressive margin expansion from record high
Source: BEA, FH calculations
Data are actual to 2026 Q2

DISCLOSURES AND DISCLAIMERS

Analyst Certification

The analyst, 22V Research Group, primarily responsible for the preparation of this research report attests to the following: (1) that the views and opinions rendered in this research report reflect his or her personal views about the subject companies or issuers; and (2) that no part of the research analyst’s compensation was, is, or will be directly related to the specific recommendations or views in this research report.

Analyst Certifications and Independence of Research.

Each of the 22V Research analysts whose names appear on the front page of this report hereby certify that all the views expressed in this Report accurately reflect our personal views about any and all of the subject securities or issuers and that no part of our compensation was, is, or will be, directly or indirectly, related to the specific recommendations or views of in this Report.

22V Research (the “Company”) is an independent research provider. The Company is not a member of the FINRA or the SIPC and is not a registered broker dealer or investment adviser. 22V Research has no other regulated or unregulated business activities which conflict with its provision of independent research.

22V Research, LLC is a professional services and independent publication organization. 22V Research, LLC is not a securities broker-dealer, not a member of the Financial Industry Regulatory Authority (FINRA), not a registered investment advisor (RIA) and not a member of SIPC.

Securities transactions, when offered, are offered by 22V Securities, LLC through LPS Capital, LLC. Certain employees of 22V Securities, LLC are dually registered as securities representatives of LPS Capital, LLC or Analyst Hub Securities, LLC. 22V Securities, LPS Capital and Analyst Hub Securities are members FINRA, SIPC.

https://brokercheck.finra.org/

Current Ratings Definition.

SECTOR OUTPERFORM: An “outperform” rating anticipates the company will outperform the S&P Regional Banking Index (peer group).

SECTOR PERFORM: A “market perform” rating anticipates the company will perform in line with the S&P Regional Banking Index (peer group).

SECTOR UNDERPERFORM: An “underperform” rating anticipates the company will underperform the S&P Regional Banking Index (peer group).

Limitation Of Research And Information.

This Report has been prepared for distribution to only qualified institutional or professional clients of 22V Research Group. The contents of this Report represent the views, opinions, and analyses of its authors. The information contained herein does not constitute financial, legal, tax or any other advice. All third-party data presented herein were obtained from publicly available sources which are believed to be reliable; however, the Company makes no warranty, express or implied, concerning the accuracy or completeness of such information. In no event shall the Company be responsible or liable for the correctness of, or update to, any such material or for any damage or lost opportunities resulting from use of this data. Nothing contained in this Report or any distribution by the Company should be construed as any offer to sell, or any solicitation of an offer to buy, any security or investment. Any research or other material received should not be construed as individualized investment advice. Investment decisions should be made as part of an overall portfolio strategy and you should consult with a professional financial advisor, legal and tax advisor prior to making any investment decision. 22V Research Group shall not be liable for any direct or indirect, incidental or consequential loss or damage (including loss of profits, revenue or goodwill) arising from any investment decisions based on information or research obtained from 22V Research Group.

Reproduction And Distribution Strictly Prohibited.

No user of this Report may reproduce, modify, copy, distribute, sell, resell, transmit, transfer, license, assign or publish the Report itself or any information contained therein. Notwithstanding the foregoing, clients with access to working models are permitted to alter or modify the information contained therein, provided that it is solely for such client’s own use. This Report is not intended to be available or distributed for any purpose that would be deemed unlawful or otherwise prohibited by any local, state, national or international laws or regulations or would otherwise subject the Company to registration or regulation of any kind within such jurisdiction.

Copyrights, Trademarks, Intellectual Property.

22V Research Group, and any logos or marks included in this Report are proprietary materials. The use of such terms and logos and marks without the express written consent of 22V Research Group is strictly prohibited. The copyright in the pages or in the screens of the Report, and in the information and material therein, is proprietary material owned by 22V Research Group unless otherwise indicated. The unauthorized use of any material on this Report may violate numerous statutes, regulations and laws, including, but not limited to, copyright, trademark, trade secret or patent laws.
