At the September FOMC press conference, Chair Kevin Warsh identified competition for capital from hyperscaler funding as one reason long-term yields have risen. We test this argument using Microsoft, Meta, Amazon, Google and Oracle’s USD bond issuance since 2023.
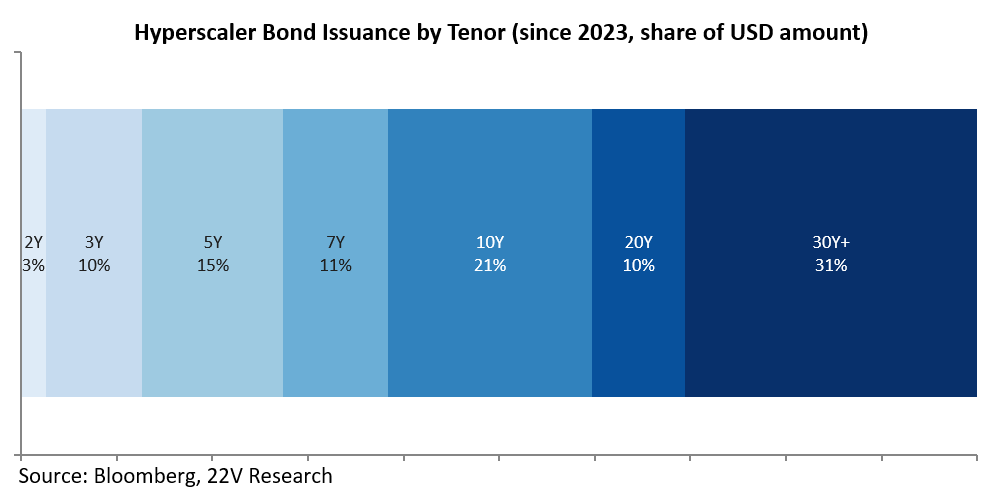
Hyperscaler borrowing is small relative to outstanding Treasury debt. Cumulative issuance since 2023 represents approximately 1% of the total. Against the flow of new supply, however, it is meaningful. Issuance over the past 12-mos equals 14% of net new Treasury borrowing, suggesting potential competition for investor capital. Supply is concentrated at longer maturities. The 30yr+ bucket accounts for 31% of issuance, compared with just 3% for the 2yr bucket. 75% of the deals occurred in 2025–2026, coinciding with the accelerating AI capex cycle.
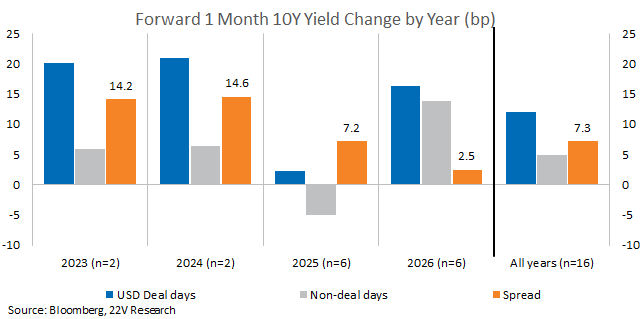
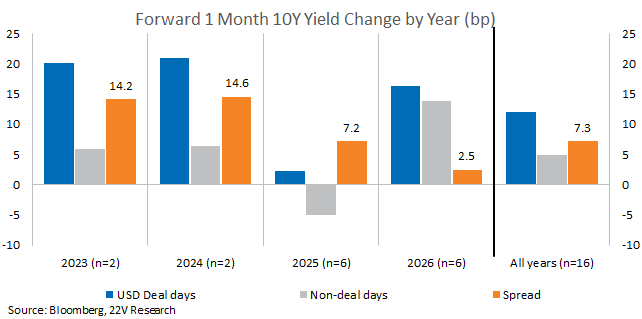
Comparing deals and non-deal days within the same year, both 10yr and 30yr yields generally rise more the month after hyperscaler issuance. These patterns are consistent with supply pressure, although they do not establish causality.
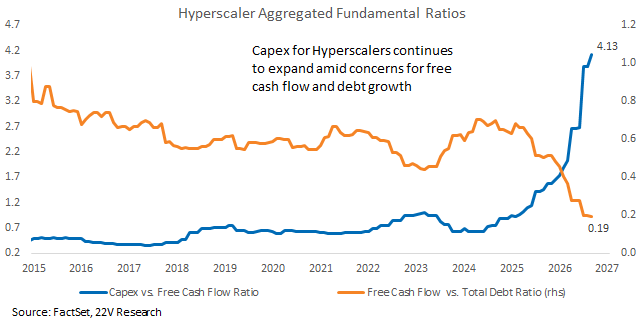
The smaller incremental effect in 2026, alongside larger increases in short-term yields, suggests the broader macro backdrop is making a substantial contribution to rising yields. Hyperscaler funding appears to be just one contributor to current rising yields. Continued capex expansion, rising capex relative to free cash flow and weakening free-cash-flow coverage of debt suggest further hyperscaler borrowing would put sustained upward pressure on long-term yields.
At the September FOMC press conference, Chair Kevin Warsh was asked why long-term bond yields have gone up, and he gave three reasons: economic strength, competition for capital and geopolitics (Here). On the second reason he said, “The surge in capital expenditures, which I referenced in my remarks, is real, and the so-called hyperscalers are out in the market raising funding, and so the competition for capital is real and I think it partly explains the increase in yields.”
To verify if hypercaler debt inssuance a reason for rising yield we look at how large hyperscalers (MSFT, META, AMZN, GOOG and ORCL) borrowing is relative to Treasury supply, where on the curve it lands, and how Treasury yields behave around deals. We collect their bond issuance from 2023 onward because the release of GPT-4 on March 14, 2023 was a milestone for AI and for the hyperscalers.
Small against outstanding Treasuries, meaningful against the flow
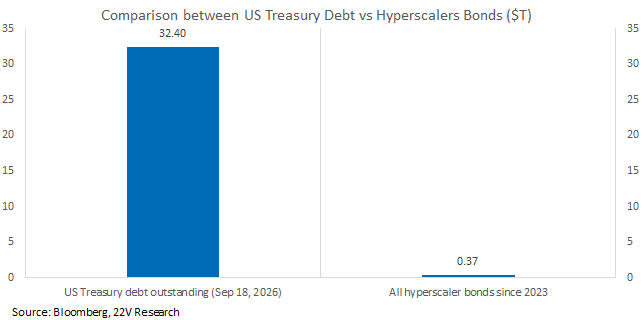
Measured against current outstanding US treasuries, hyperscaler borrowing looks negligible. All the bonds the hyperscalers have issued since 2023 amount to only 1% of US Treasury debt outstanding.
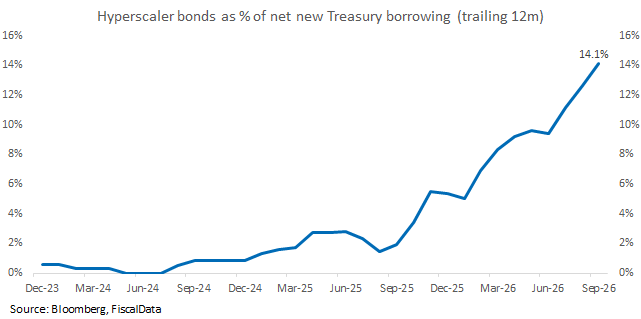
Compared to new supply, which is what the market must absorb at the margin, hyperscaler bond issuance counts 14% of net new Treasury borrowing over the past year, a scale at which the two are competing for the same pool of capital.
Issuance is skewed toward the long end
Hyperscaler supply is also concentrated at the long end of the curve, which is where Warsh’s comment applies. We compute the tenor of each bond at issuance, round it to the nearest year and map it to the nearest US Treasury benchmark bucket (2Y, 3Y, 5Y, 7Y, 10Y, 20Y and 30Y+). For example, a 6.76-year bond is mapped to the 7Y bucket and a 38.01-year bond is mapped to the 30Y+ bucket. Measured by the USD amount raised, 30Y+ is the largest bucket at 31% of all hyperscaler issuance since 2023, whereas the 2Y bucket is only 3%.
Hyperscaler issuance is concentrated in time as well as on the curve. Of the 16 hyperscaler deals in USD since 2023, 12 were priced in 2025 and 2026, so 3/4 of the deals fall in the two years in which the AI capex cycle accelerated. This clustering matters for the yield test that follows, because 2026 is also the year in which Treasury yields rare rising most broadly, and a comparison against every trading day since 2023 would credit the deals with part of that macro move.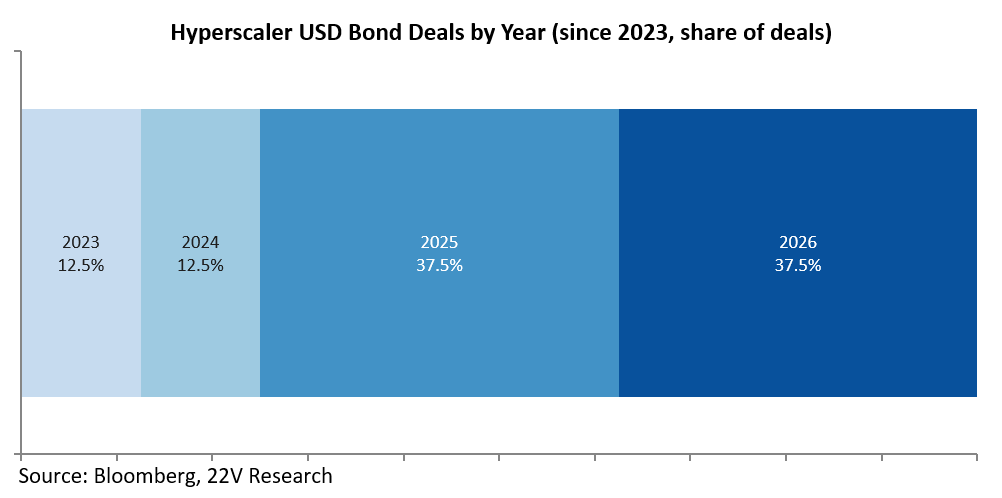
Yields rise more after hyperscaler deals, but macro weight more
We compare each deal with the Treasury yield of the same tenor, starting with the 10yr and the 30yr as the benchmark long-term yields. Since 2023 there have been 16 dates on which one or more hyperscalers priced a USD deal that included a 10yr and 30yr tranche. Comparing the yield changes forward 1 month post hyperscaler debt issuance with other 1 month yield changes without debt issuance in the corresponding year, deal days show a larger 10yr yield move across all years, which is partially pushed by higher hyperscalers debt supply.
The 30yr yield follows the same pattern. Across all years it rises 5.4bps more over the forward 1 month after a deal than on non-deal days of the same year.
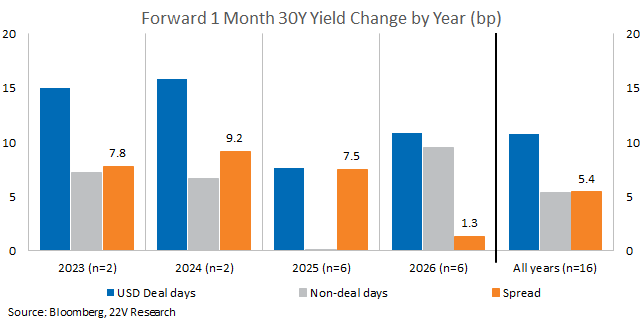
The yield curve moves this year have been higher, especially for 2yr and 3yr yields, while the long-term curve moves are milder, in which the hyperscaler debt issuance clustered. It suggests that a large part of the rise in yields coming from the broader macro backdrop change than pure hyperscaler debt supply.
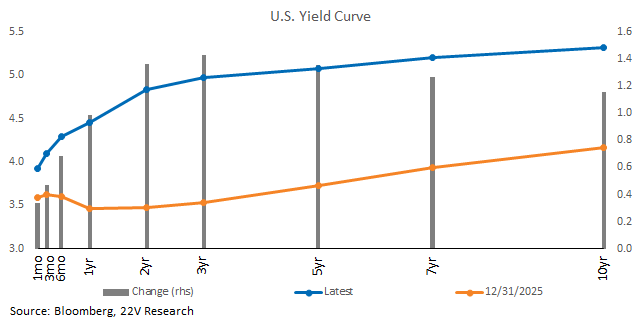
Taken together, the evidence supports Warsh’s view that hyperscaler funding is part of the story, but only part of it. As hyperscalers capex is likely to continue to expand from here, leaving capex vs. free cash flow climbing higher and free cash flow vs. total debt ratio dropping to the lower range. The debt issuance is likely to continue to increase and weigh on yield to some extent.