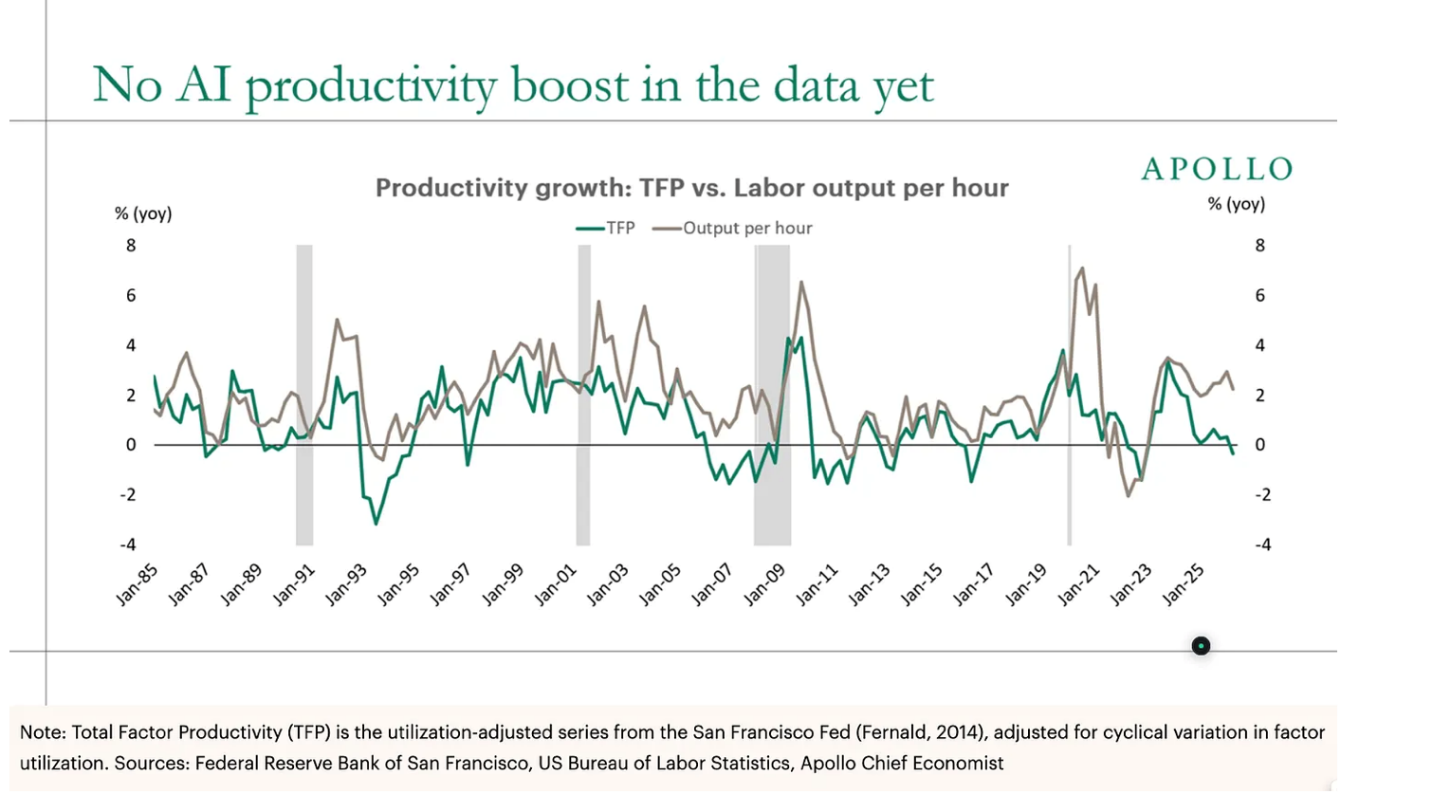
Main point: The idea that the bond bear is mostly about AI capex is probably wrong, although we might want to include in the AI effect the stock market boom, which has lifted consumption. Separately, the debate around whether total factor productivity growth has picked up needs to be considered in light of an obvious measurement controversy.
Paul Krugman has an interesting blog post discussing one aspect of the threat from AI that may be more a current reality than a speculation. We don’t know if AI will go rogue and destroy humanity. But Krugman claims that we may be fairly confident that the AI capital spending boom is right now crowding out other forms of investment, by forcing up interest rates.
Krugman’s formulation
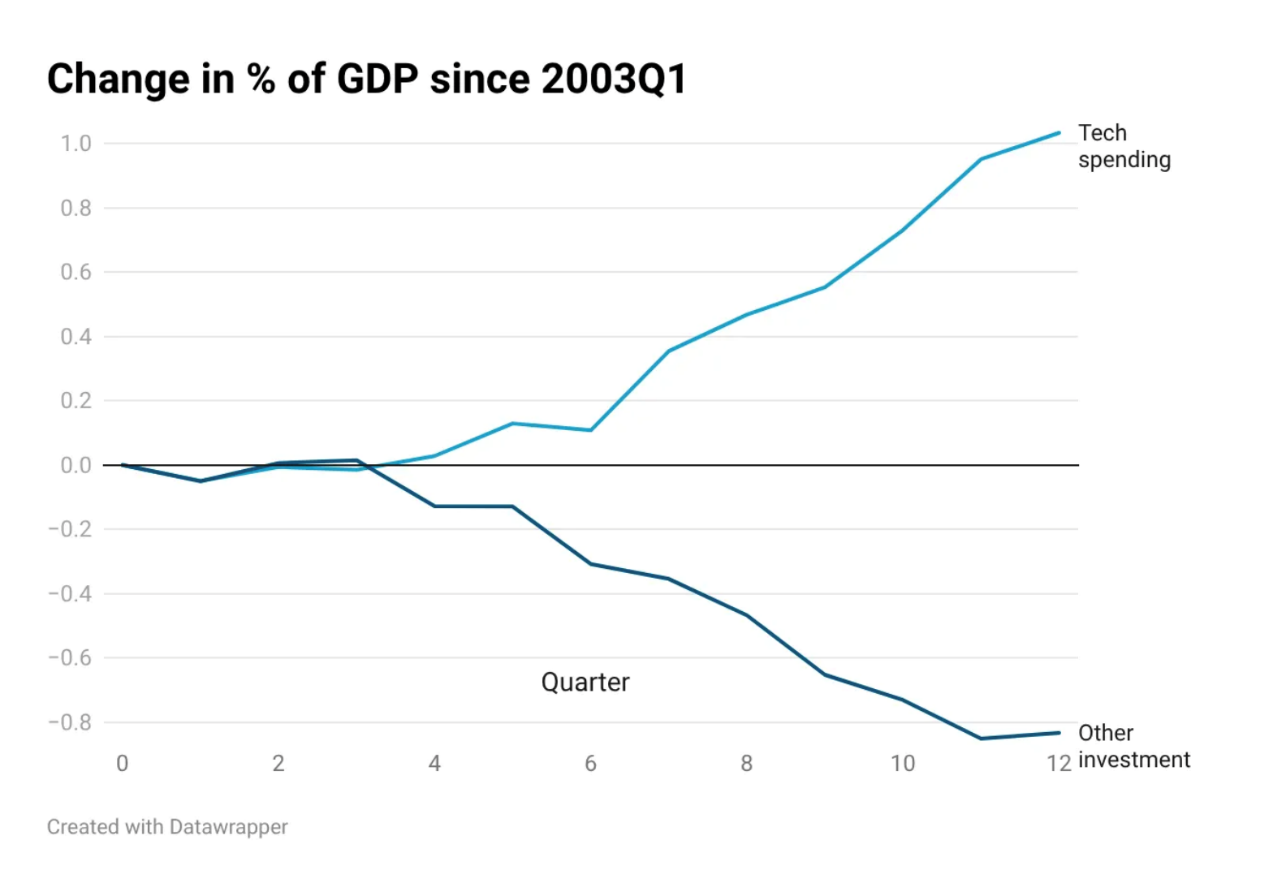
The main evidence is the chart offered above. Krugman splits over fixed investment (including in residential structures) into what he calls AI-related and the rest. And the rise of the AI component does seem to be mirrored by a decline of the non-AI of roughly similar magnitude. I am not thrilled with Krugman’s taxonomy here. I don’t think all tech spending is AI-related, so I would swap his use of information processing equipment in favor of computers and peripherals. But on the other hand, I would add to his measure of software spending other forms of intellectual property development, such as – most importantly – research and development.
My robustness check comes back mostly positive, as the chart looks pretty similar. The rise in the tech component is 50% larger than the decline in the non-AI component. And this fits with the view that overall fixed investment has added about 70 basis points to GDP growth since early 2023, outperforming its weight in the economy by about 25 basis points. But obviously, that is not a huge lift, so the basic point does fit with Krugman’s main claim. Indeed, if we were to take on board that the hardware component of the AI spending boom is almost entirely importable, we would find that the contribution to real demand growth here has been slightly negative. So, I have no quibble with the numbers.
My formulation
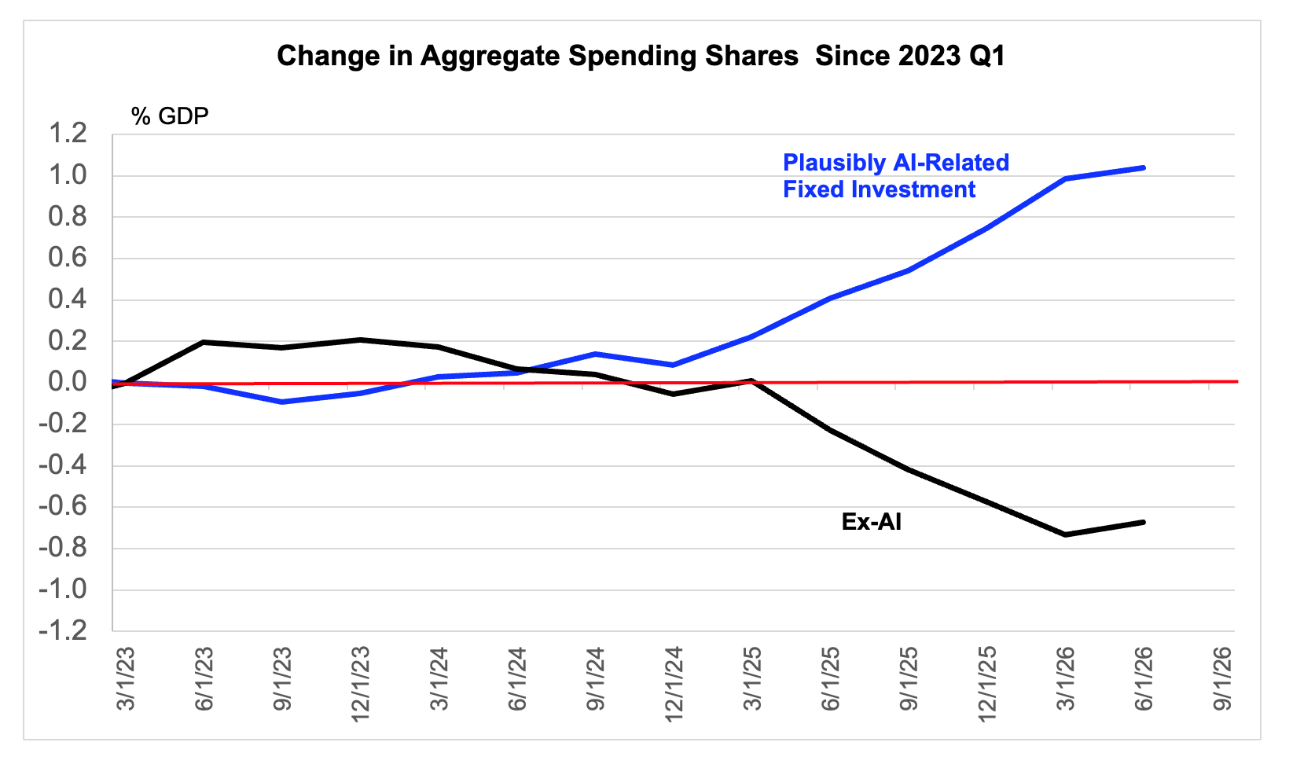
Data are actual to 2026 Q2
I do, however, have a slight quibble with the reasoning. It strikes me as totally plausible that the stagnation (not collapse!) in residential investment over the past few years has been a function of the rise of bond yields associated in part with the impetus to aggregate demand growth and inflation from the AI boom. But a similar stagnation in structures investment, even inclusive of the bricks and mortar in data centers, has helped at the margin to contain the bond yield rise and thereby arguably crowded in strength in AI. Another way to put this, which allows the bond market to cancel out of the algebra, is to say that the AI boom would have had to be weaker to respect the speed limit if it were not for the headwind to aggregate demand growth from structures.
Another area where I have an issue with Krugman’s analysis is in his claim that the AI boom has not been financed by capital inflows, unlike the tech boom of the 1990s, which – on other grounds as well – involved less crowding out. I am not sure I agree with Krugman on this because the current account blowout (capital inflow surge) to which he refers happened after the 90s tech bubble burst and was related more to developments in housing and housing credit. Today’s current account deficit is very comparable with the deficit in, say, late 1999.
Yes, it is, no, it ain’t
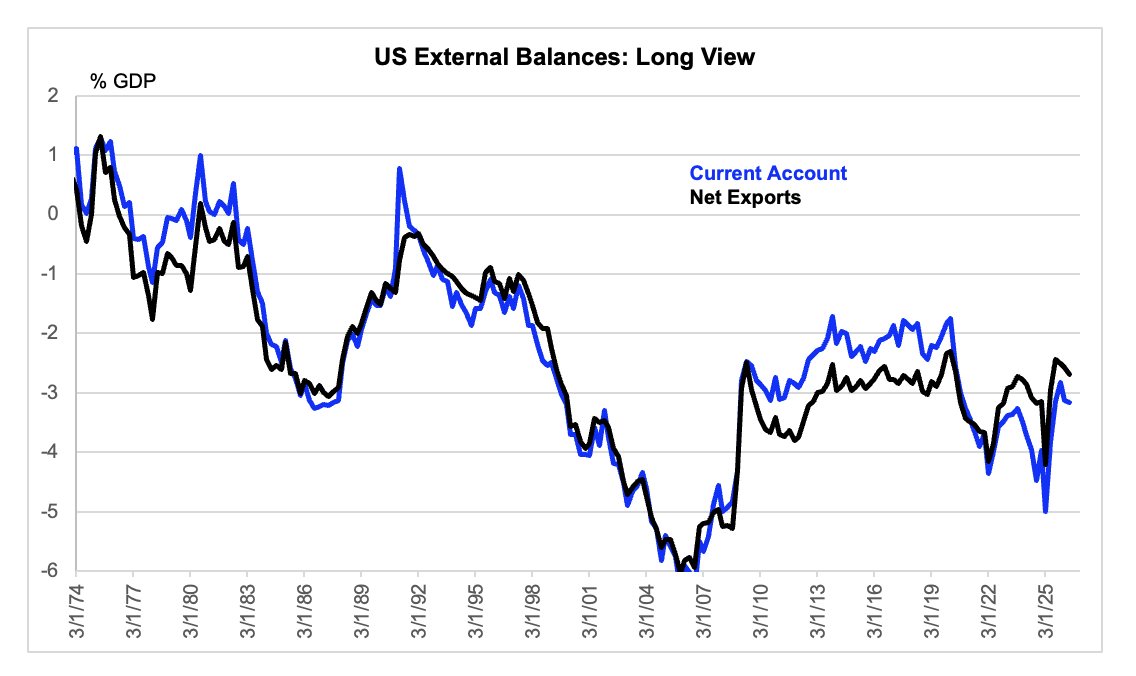
Data are actual to 2026 Q2.
I point that out because I dislike factual misrepresentation. But the larger issue here is the overall current account deficit is not necessarily a measure of how much of the AI boom is being financed by capital inflow. To assess that, we need to think in terms of the counterfactual. As I mentioned above, the hardware component of the AI boom is almost entirely importable. So, the current account deficit would seemingly “want” to be smaller were it not for this boom. Alternatively, if we think of the capital inflow as given, then the dollar would have been stronger and other tradable sectors would have been weaker were it not for those AI imports facilitating the desired capital inflow. So, I think Krugman is taking some liberty there.
But here is where I net out on this. The AI boom has probably lifted aggregate demand growth over the past few years by about 50 basis points, inclusive of trade drag. And even this figure requires that we assign entirely to AI components of spending that are plausibly related to AI, as discussed above. Whether this has involved a crowding out of housing or been a result of crowding in weakness in ex-data-center nonresidential structures is more of a normative debate, on which I cannot add much that would be helpful to you.
If I had to pick, I would say that the larger source of upward pressure on interest rates has been the strength in consumer spending, which has reflected both the stock market boom and, to a lesser extent, the stimulative effect of the large fiscal deficit – expressed in level, rather than rate of change (Keynesian impetus) terms. A corollary of this is that a stabilization in AI spending would deliver a lesser hit to incipient demand growth and thus lesser support to the bond market than Krugman’s (and others’) narrative implies. Still, it would be highly relevant, obviously. And an outright contraction there would be a very big deal that we need to stay alert to. Also, if you want to claim that the stock market boom is itself AI, I will not fight you on that.
TFP measurement may be wrong
Let me conclude with a slight change of subject, while remaining on the topic of AI. Brad Delong has his own blog post assessing the claim that the AI boom has so far resulted only in capital deepening, which mechanically raises labor productivity, without involving any improvement in total factor productivity, which is the true measure of the extent to which tech innovation is leading to real advance. Delong is not quite on board with that claim – or with its broader implications – and mentions three places that tech innovation can show up:
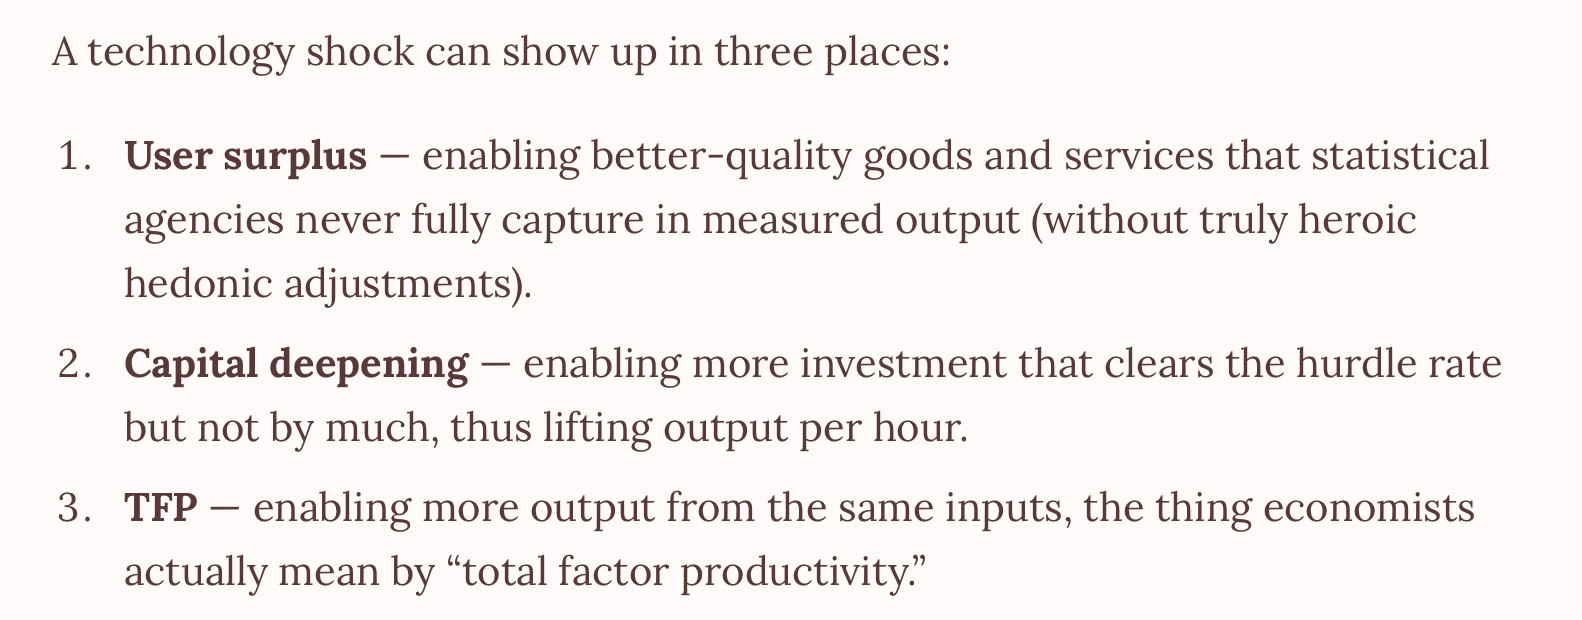
I will not try to outwit Delong in his main space, but I think point number 1 deserves some amplification. The practical implication of what Delong is getting at – skipping the argument in the interest of time and space – is that TFP growth will be systematically understated when the main participants are trying to obtain first mover advantage (which is meant to be huge) by undercharging (or not charging at all) for their products. And it follows further from this, that measured TFP may pick up when the corporate leaders begin to claw back that consumer surplus by actually charging. This raises the darkly humorous possibility of AI skeptics identifying a TFP recovery after the profits among the AI participants have already gone to the moon. I am not saying that will happen. I am saying that I would assign little relevance to the stagnation in measured TFP growth. Hedonic adjustment is no big deal when tech advance is steady. It is a huge problem when it gaps, because of an index number problem we need not get into here — in part because I would have to spend a day reading to refresh myself on it. 😉
My thoughts on the labor productivity growth related to capital deepening actually go the other way, although probably not by enough to offset Delong’s more important point. I assume, without having done the work yet that much of the revival in labor force productivity is related to the production of the AI related tech goods and services themselves. That part may be somewhat illusory or circular. I would keep an open mind to the possibility that the thing that is meant to matter (TFP) is doing better and that the thing that is meant to be merely mechanical (labor productivity) is a bit misleading, just perhaps unimportantly so.
I would be skeptical, not of AI’s relevance but of this chart