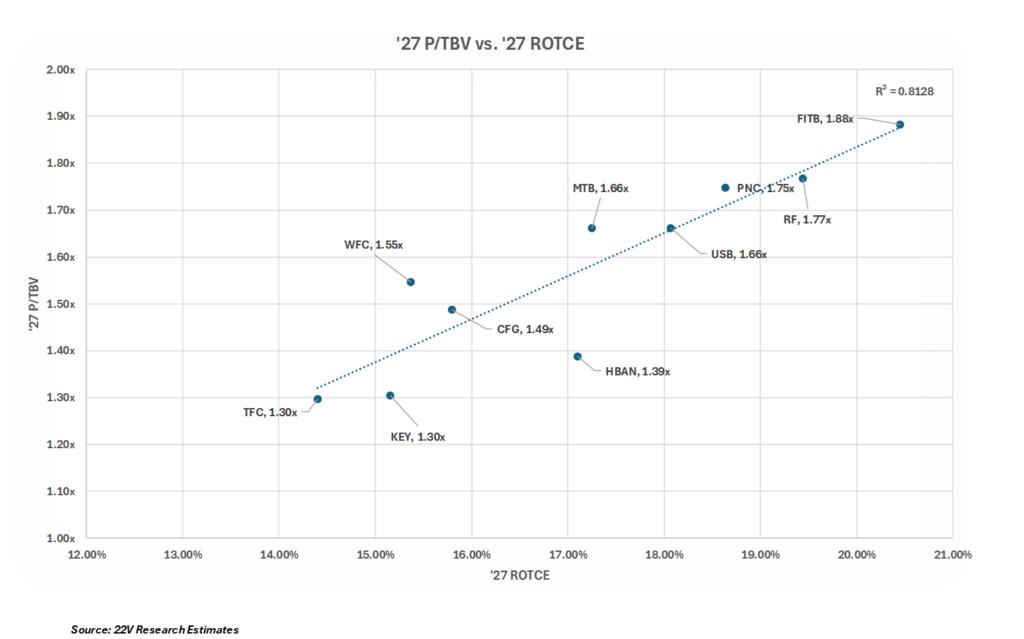
While the banks recently gave the “all clear” on credit, that doesn’t mean the concern goes away overnight. But as many presenters noted, a 25bps hike would have very little impact at all given the strength of the economy. In our opinion, the same can likely be said if we go to 50 or 75bps (remember we were there just a year ago). However, if we have to push rates up 4-6 times in total, then we can see the narrative changing. Early days, but we tend to think that cooler heads will prevail.
Source: Bloomberg
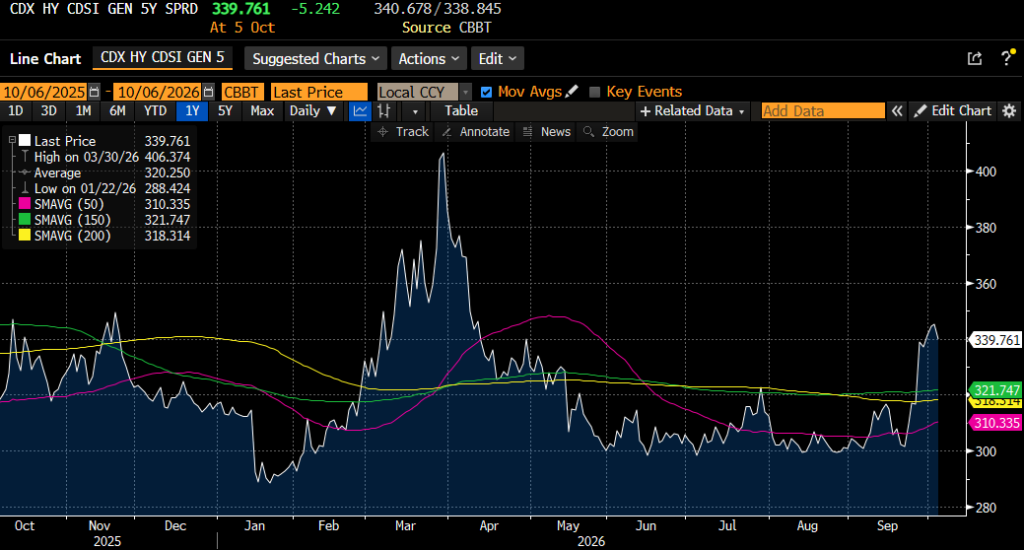
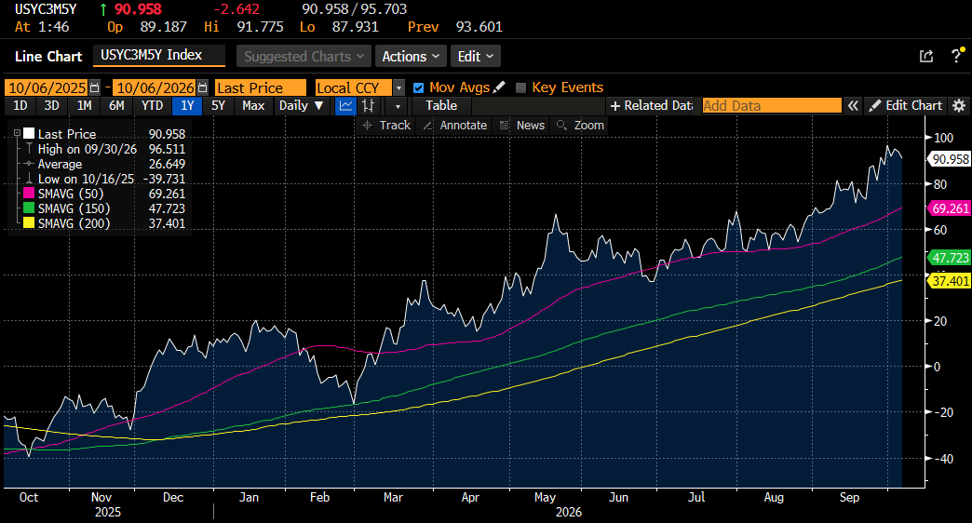
- Steepness of the Curve – during the exercise we just went through, the 2-10 spread moved from ~55bps all the way down to ~18bps before bouncing back to ~49bps. As we’ve mentioned numerous times, we do NOT think the 2-10 spread is a good proxy for a bank’s internal yield curve. We believe the 3M/5Y spread does a much better job of representing deposit costs relative to asset yields, and in the case of the 3M/5Y, it’s done nothing but expand from ~55bps to ~95bps during the same period – a positive. A steeper higher yield curve has been the friend of banks historically and the incrementally higher roll-on yields help give the fixed asset reprice story continued legs.
Source: Bloomberg
- Deposit Pricing: Deposit pricing has been a concern for folks over the last few Q’s for a few reasons (agentic AI being one of them). But given where we were in the rate cycle, it made sense. With no change in the Fed Funds rate and robust loan growth, the expectation of deposit price pressure was perfectly logical. Fast forward to today, and loan growth has moderated significantly from the pace in 1H’26. In addition, we would argue that when variables move (like the Fed Funds rate) which is passed through to customers at least partially (deposit beta), behavioral finance would suggest that the propensity to comparison shop down to the last basis point (at least for retail money) subsides. One could argue – “hey, that’s what my AI agent will do” which we’ll get to in a moment. We look at each bank’s deposit beta individually to get a sense of the impact, but customers want to largely feel like they are at least seeing some of that pass through and the banks do their best to figure out the elasticity before someone becomes dissatisfied enough that they move their deposits. While we’re on the topic of moving deposits….
- Agentic AI – For us long time bank analysts, there’s a propensity to want to dismiss a new technology in favor for the way things have been done in the past. We don’t want to make the mistake of doing such as we believe agentic AI will be a powerful new technology that very well may have profound impacts on the economy. We’ve seen a few analyses looking at much higher deposit rates paid by more “non-traditional” financials and the belief that is an opportunity for Agentic AI. While fair, that is not a new phenomenon. The question is, can Agentic AI make people comfortable enough to finally make the switch in a more meaningful way? A few thoughts:
- Assessing the true TAM: We pointed out back during the 2Q conference season when this issue came to the fore, that we felt like the TAM might be a little narrower than one would think. For checking accounts, the banks gave granular data with the average checking account largely being sub-$7,500 with the propensity to try and optimize given the transactional nature of those deposits being quite low. For mid-large size businesses with a CFO constantly optimizing their company cash, they’re likely already participating in some sort of treasury sweep program. Again, one would think that the TAM there would be somewhat limited. That said, for larger savings account balances/wealth management accounts or even some small businesses without a full time CFO where balances can be quite a bit larger, there is likely an addressable market here that over time could see some disruption.
- Adoption: So when are we going to see it? Once again, we’re in the world of behavioral finance. The essence of the question is really when do you feel comfortable giving over login and password information to an AI agent to optimize your account? 1.) Will the banks allow it? 2.) If they do allow it, are you more likely to use AI agents to optimize other areas of your life where the risk of a negative financial impact is limited (like analyzing your subscriptions and cancelling/optimizing services you don’t use or need?) 3.) What happens if there’s fraud (hackers are always trying to hack individual’s financial information – why not hack your AI agent)? 4.) In the event of loss, who makes you whole? Does XYZ technology company set up a reserve for agents gone awry to reimburse you for the $10,000, $100,000, or $1mm that you lost? Are you really going to feel 100% comfortable handing over a significant amount of deposits to your AI agent for optimization? While just a sample of some of the considerations regarding Agentic AI and deposits, that doesn’t mean the impact will be zero. We think as some of the kinks are worked out, there can be a portion of the deposit base that may very well want to use an AI agent to optimize and it’s something we will monitor over time. Also remember that the banks are unlikely to sit idly by and let themselves be disintermediated. Rember also that we’re only talking about one side of the balance sheet. If the banks do down the road end up having to pay more on deposits, they will likely charge more for loans. It’s a spread business and one has to think the banks will do what they can to defend their margins. Regardless, while it’s a big focus at the moment, our intuition is that as the use case for Agentic AI grows, the deposit optimization opportunity will be one of the areas that grows less quickly early on until there’s a more established framework and guardrails to make customers feel safe in handing over the keys to their financial well being.
Ratings Changes:
- We’re upgrading our ratings on 3 of our large cap regionals:
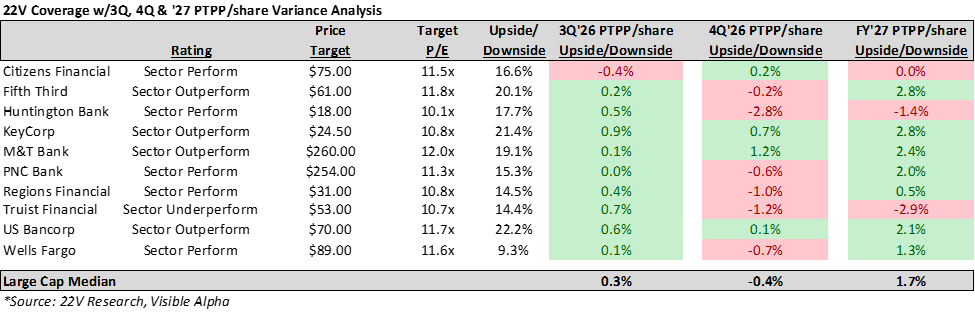
- M&T Bank – from Sector Underperform to Sector Outperform. Our price target moves up to $260 from $252 or ~12x our FY’27 estimate. There are a few reasons for the upgrade. First, the inflection in balance sheet growth which we saw happen in 2Q and is continuing into this Q. We believe MTB has now moved past the runoff within their commercial real estate portfolio and given their recent conference commentary, it appears that loan demand is strong across all verticals. The second important change is the rate path. Given their natural asset sensitivity, our NII estimates move up. We are now ahead on pre-tax pre provision for 3Q, 4Q and FY’27 assuming our new Fed Funds assumptions (hikes in Sept, December and March built into all of our models). The other key positive for M&T relative to peers is their AOCI position. With rates rising again, those who have managed their available for sale investment portfolio and swaps book well will stand out relative to peers. In this case, M&T’s almost negligible AFS mark to market loss leaves M&T in a very solid tangible capital position (~8%) relative to peers. From our perspective, M&T should continue to act defensively in this new environment given their asset sensitivity driving better NII, low mark to market losses in their AFS portfolio, history of strong credit, and seasoned management team. For investors looking for a more defensive name with earnings upside and strong credit and interest rate risk management profile, we would recommend MTB.
- KeyCorp – from Sector Perform to Sector Outperform. Our price target remains $24.50 or ~10.8x our FY’27 estimate. Key’s solid recent guide especially in terms of loan and deposit growth along with solid capital markets activity sets them up well into the end of this year and into ’27. We think KEY can progress towards their 4Q’27 exit NIM guide of 3.25% (we’re at 3.20%) but on a bigger balance sheet given less runoff in the resi book due to higher rates. In terms of the acceleration of the NIM into FY’27, we believe the deposit growth this Q will largely help them shed their wholesale funding. That along with a decent amount of relief in the swaps against the securities portfolio (will swing from a headwind to a tailwind by 4Q which we think is underappreciated) also provides a tailwind. In addition, the fixed rate reprice in both the loan and securities book should also be a bigger benefit than many peers. In sum, we’re ahead of consensus for the next 2Q’s and have one of the largest PTPP beats relative to our coverage for FY’27. As such we’re upgrading to Sector Outperform.
- Wells Fargo – moving from Sector Underperform to Sector Perform. We tweak our price target up to $89 from $86 or ~11.5x our FY’27 estimates. The key delta from our perspective is the stabilization WFC is starting to see in their margin which they discussed at the most recent conference. The fact that Wells is becoming more efficient when it comes to structuring their repo book (reducing the assets due to netting without altering the economics), hopefully means that the margin compression is now behind them. Recall, the bloating of the balance sheet/margin degradation has been the major thrust of our Sector Underperform call. While we believe WFC still has a ways to go in terms of closing the ROTCE gap from mid-teens to high teens, it’s good to see WFC no longer degrading their margin to fund the investment bank. In addition, given their 10Q disclosures, WFC does screen as asset sensitive which should also help on the margin. The question will be the beta pass through given the most recent experience for WFC occurred during the asset cap.
Variance Analysis
Thoughts on the remaining large regionals:
CFG: Loan growth pulled forward into 2Q. Added another 2bps of deposit price pressure from rate sensitive corporates and wealth mgmt. customers. Bottom half of the NII guide for 3Q (+2.8% vs. +2.5%-3.5%) but expect a NIM rebound in 4Q to 3.26%. 2H’26 PTPP still a bit ahead. Assuming 48% deposit beta equivalent to the through the cycle betas of last cycle.
FITB: Solid recent guide (NII/fees higher, expenses lower) and asset sensitive tilt a clear positive with our ’27 estimates well ahead of consensus assuming 3 rate hikes. In the event higher rates cause dislocation in credit quality, we like the fact that leveraged loans are now sub-2% of the portfolio vs. ~8% in 2015 and 2nd lowest exposure to NDFI loans among peers.
HBAN: Believe the margin stays muted this Q (perhaps down in 4Q due to lagged balance sheet growth) but even though roughly in-line on this Q’s PTPP, we believe street may still be too high for 4Q’26/FY’27. No reason to step in yet in our opinion. Moving our price target down to $18 from $19.50 or ~10x our FY’27 estimate.
PNC – Essentially in line for 3Q but still a bit below for 4Q with NII being the key delta. Higher commercial deposit costs (+5bps) being called out this Q which takes NII to +3.2% this Q. Expecting ~2% NII growth in 4Q’26 before being ahead of consensus again in FY’27 as the higher securities yields earn in. Longer term (FY’27) estimates intact.
USB – Ahead again as the Barclays conference marked the 3rd time the company has guided up in as many quarters. We continue to view USB as one of the better margin re-rate stories in the sector (fixed asset reprice + mix shift) and do have them achieving the 3% NIM by 4Q’27.
RF – In line update, pivot to more investment grade credit growth, and mid-30’s deposit beta suggest that the Q is tracking fine. Small improvements to #’s in FY’27 but the mix shift is muting some of the fixed asset reprice and resulting upside even though RF screens as nicely asset sensitive.
TFC – Receiving more attention from investors given new CEO Mike Lyons beginning to reposition the bank out of some of the most credit sensitive areas (near/sub-prime consumer) and using the sale to reposition the AFS securities portfolio. We do understand the trade-off of lower PTPP against lower credit costs resulting in “modest earnings accretion.” If we were to just isolate where we would have shaken out post the announcement relative to the $5.00 VA consensus eps estimate as of 9/14 (pre-Barclays), our new number would have been ~$5.08 which would have been ~1.6% better and modestly accretive. That said, if you layer in 3 hikes into the model and reassess including the impact on the swap portfolio, our eps estimate is now back to $4.96 vs. the new $5.02 consensus. On a PTPP basis, that puts us 2.7% below consensus. While we do genuinely think that over time, the restructuring will bear fruit, in the interim, the NII headwinds from the swap portfolio will limit eps improvement from the strategic actions to date.