Back Portfolio Strategy

Real Economic Growth is Still the Primary Driver of 10yr Yields

Published on September 24, 2026

∙ Download the PDF Report

By

Dennis DeBusschere

Kevin Brocks

Sophia Wang

DAILY STRATEGY: Our framework for thinking about macro backdrop remains the same. The Speed limit on economic growth is a constraining factor. The speed limit for the US economy is roughly 2% real (See video HERE). As Gerard put it, when growth is running above the 2% speed limit, “the economy is at full employment and inflation is running above target and the fiscal authority is dumping a ton of demand and “safe” assets into the economy, then the capital markets are going to figure out a way to deliver some restraint.” That is what is happening now.

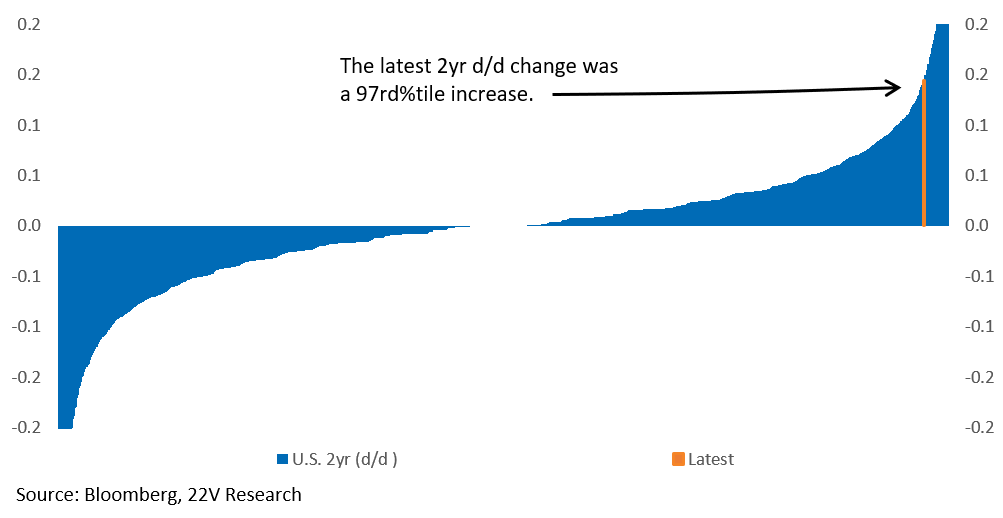
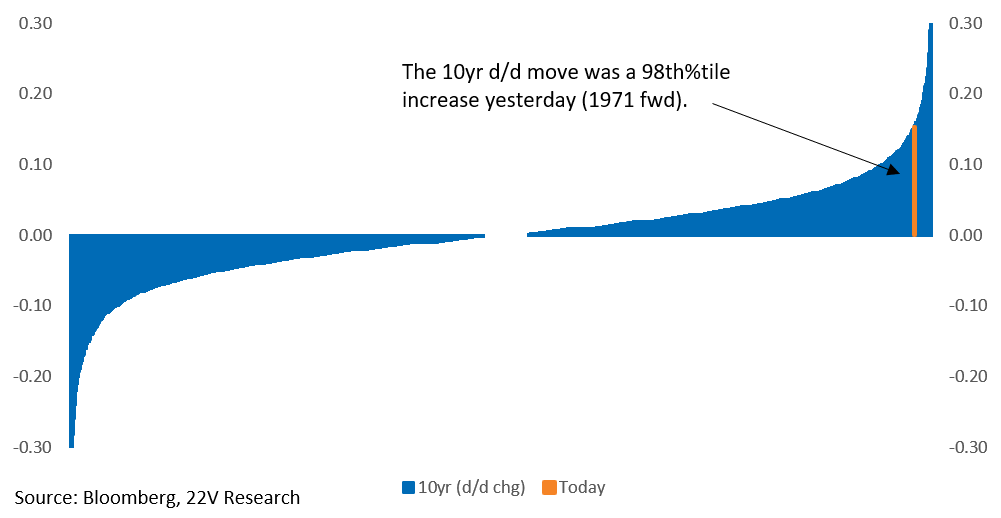
Important background – Strong Real Economic Growth is Still the Primary Driver of 10yr Yields. Not an Expected Inflation Shock. That is MUCH LESS BAD for equities. 10yr yields registered a 98th%tile dod move yesterday, but the VIX is still at 16, well below the 20 level registered in late July, when the 10yr was ~4.65%. HY CDS spreads are LOWER than they were in late July. Inflation expectations have declined. 10yr yields are providing the needed restraint to guide economic growth and inflation lower. The economic restraint that the capital markets/Fed is providing will slow growth. Our call is that the growth slowdown will be gradual (toward 2% real), inflation risk will be lower and that is eventually positive for equities.

The risk to our call is 10yr getting to a level (5.2%? 5.5%?) that leads to much higher recession probabilities (VIX higher, HY CDS spread blow out). We are not there yet.

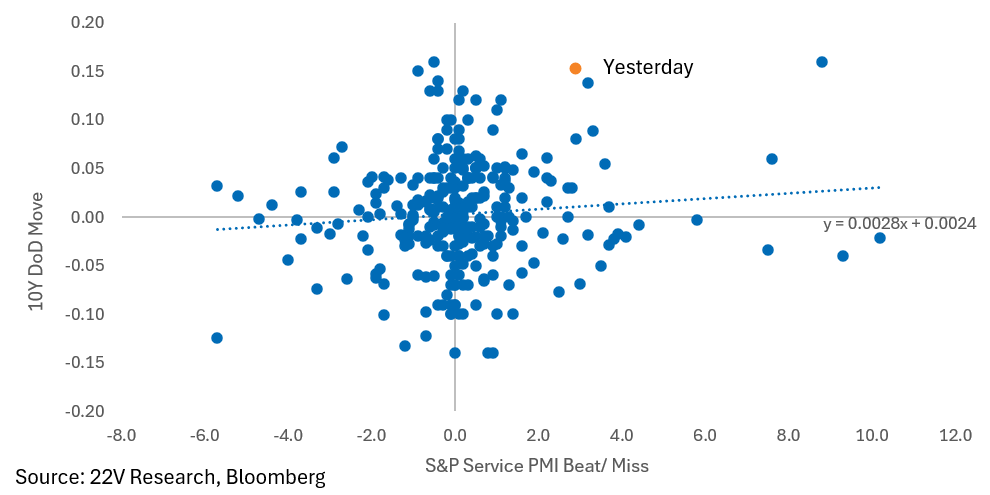
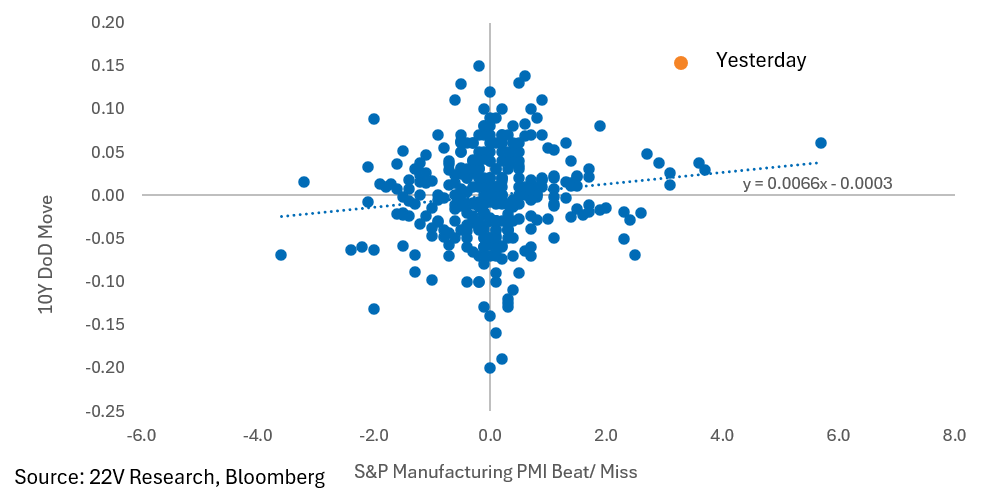
Strong Data Yesterday and Especially Relative to Expectations – The S&P US PMI beats on both services (58.7 vs 55.8 expected) and manufacturing (57.0 vs 53.7 expected) were 90th percentile+ and strong PMIs were a global phenomenon (Eurozone aggregate services 53 vs 51.4 expected, manufacturing 52.7 vs 52.6 expected). One of the reasons the reaction in UST yields was so dramatic was expectations of downside risk to the S&P PMI given some recent weakening in the regional PMIs. We got a 90th percentile beat instead.

In a cycle that is above the economic speed limit, stay long the primary source of strength. In this case AI, both the buildout beneficiaries and the companies effectively implementing the tools (lot more on the fundamental strength HERE and HERE).

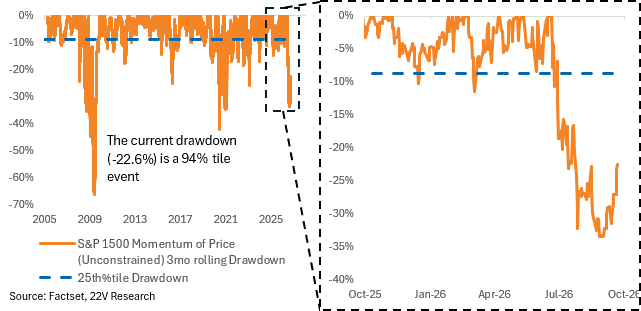
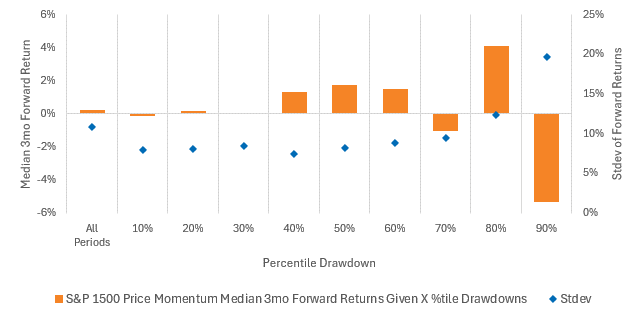
Momentum Drawdowns & Returns – The current Momentum drawdown (-23%) is in the 9th decile. Similar drawdowns had worse forward returns, but those were in the GFC and COVID, a bad sample. Based on (admittedly smaller) non-recessionary drawdowns, there is no evidence of a higher probability of negative forward returns. In other words, the historical data does not suggest returns are stacked against Momentum here.

The returns also do suggest volatility is likely to remain elevated, which will be important to risk manage around. We will have more on that as earnings season approaches.

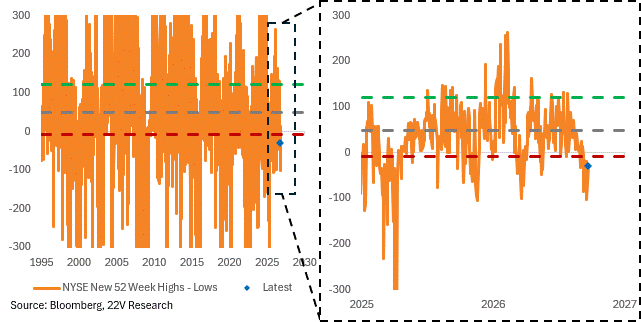
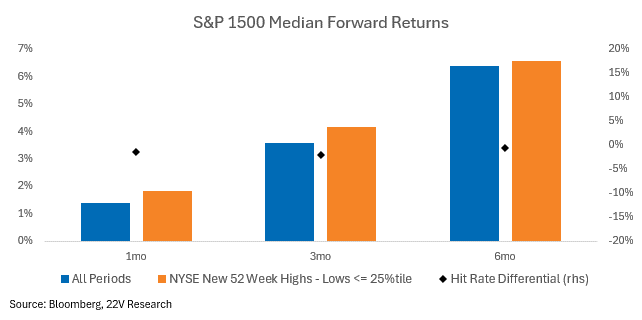
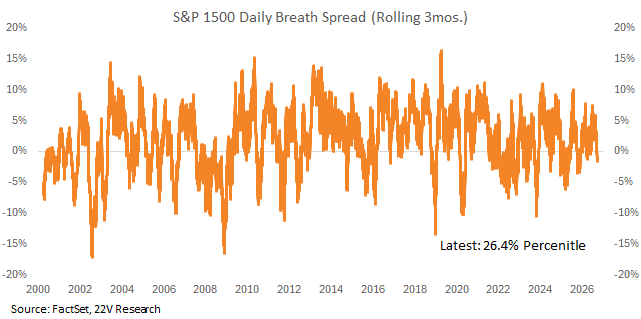
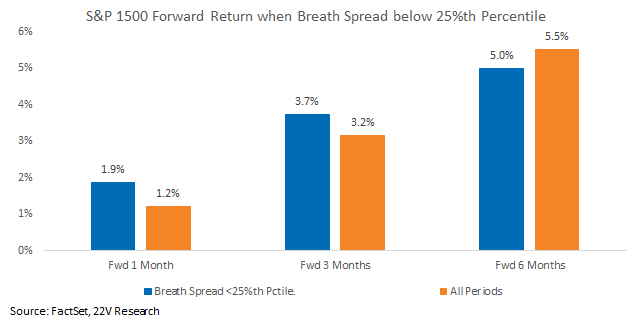
Breadth of Returns – Doesn’t Tell You Much: The percent of stocks making new highs relative to new lows is unusually low (18th percentile), but the forward return profile is roughly the same. The ratio of advancers relative to decliners isn’t at an unusual level, and the forward returns from unusual signals are the same as all periods anyway too. We are not bullish. Just noting that using market breadth as an indicator has not yielded much historically.

Charts…


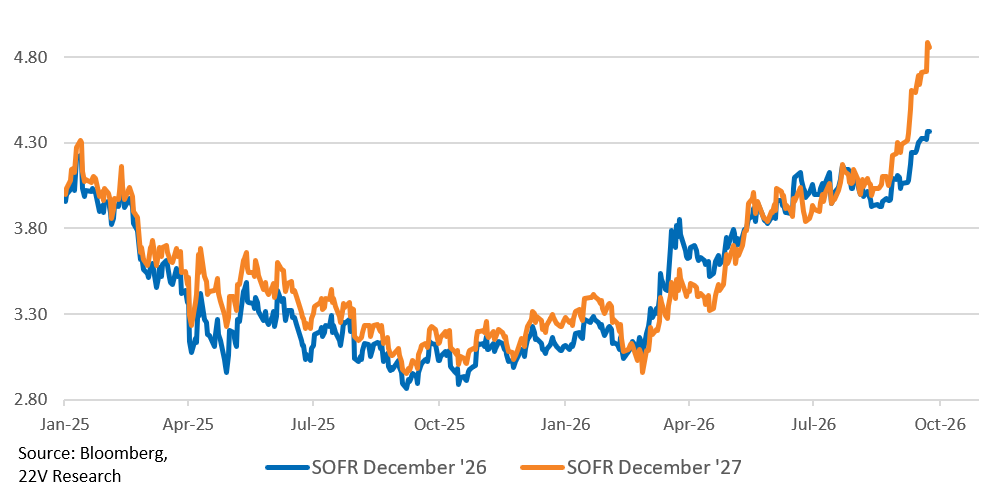
Fed rate hike expectations continue to move higher as GDP growth remains firm.
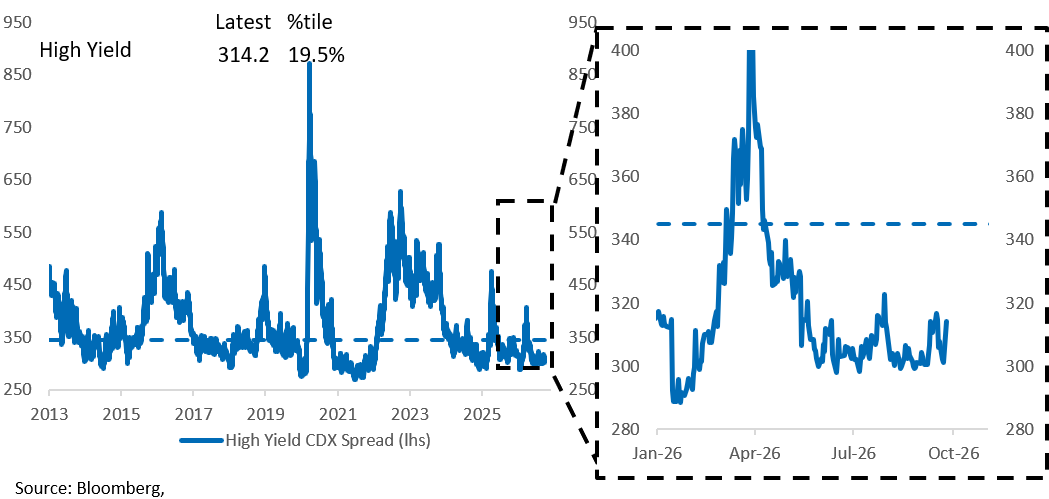
High yield CDS spreads remain tight though. The market is not pricing in a high probability of a recession.
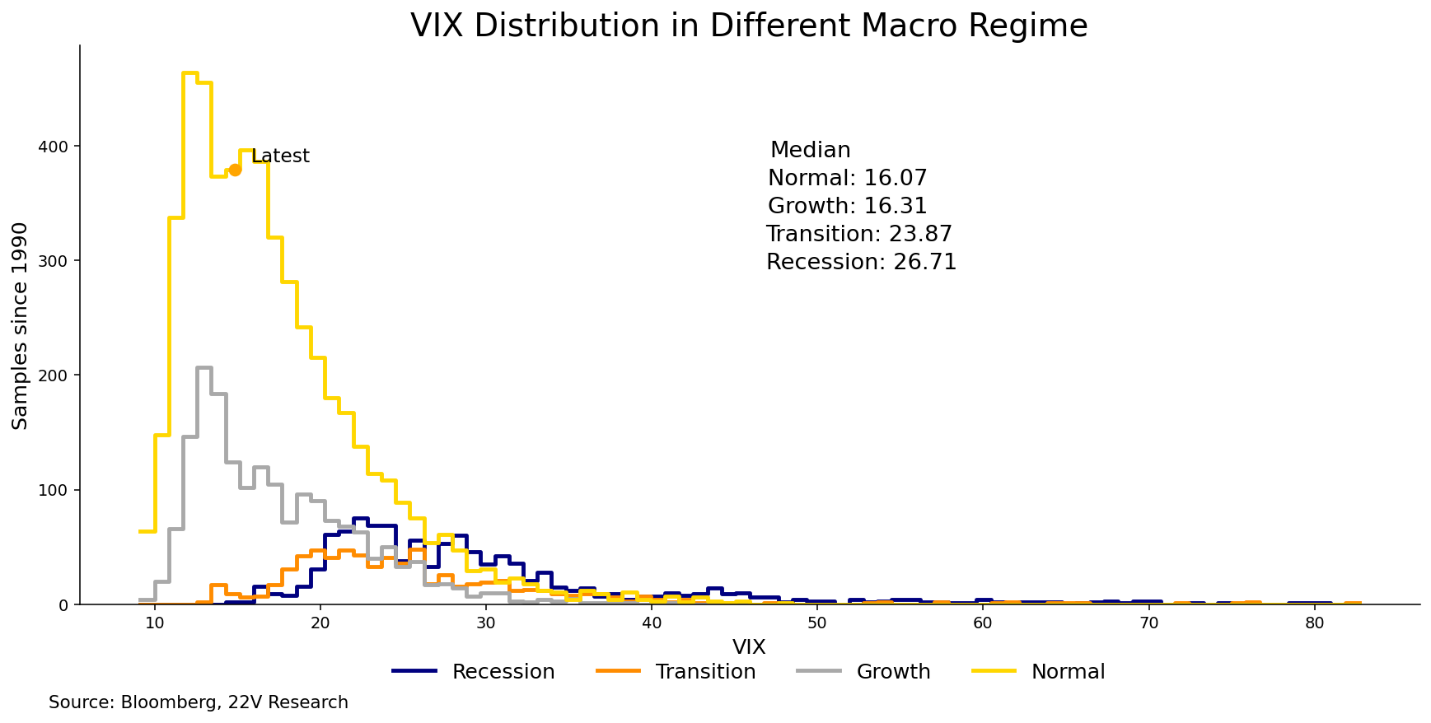
The VIX at 16 is what you would expect in a normal economic expansion. If the normal economic expansion was at risk, the VIX would be significantly higher. 10yr yields could get to a point that leads to a much higher VIX. It just hasn’t happened yet.
The current Momentum drawdown is a 94th percentile drawdown, exceeded only by the GFC and COVID.
Cutting up the forward return profile of Momentum given different decile bucketed drawdowns shows 1) better forward returns starting in the 4th – 6th decile buckets, with 2) forward vol increasing exponentially as drawdowns deepen. The forward return profile deteriorates for even deeper drawdowns, but the sample becomes recessions, which is not a good comp to now. We take the practical implications to imply forward returns aren’t stacked against Momentum here. We can be comfortable leaning into a macro thesis to be long Momentum.
New highs – new lows are at an unusually low level (18th percentile), but the forward return profile of equities from similar levels skews slightly better than normal. Nothing to be concerned about here.
The breath spread measured as (advancer – decliner)/(advancer + decliner) isn’t at an extreme level, and similarly wouldn’t signal much anyway.
The S&P PMI beats were 90th percentile+ beats, contributing to 90th percentile+ increases in Treasury yields.
DISCLOSURES AND DISCLAIMERS

Analyst Certification

The analyst, 22V Research Group, primarily responsible for the preparation of this research report attests to the following: (1) that the views and opinions rendered in this research report reflect his or her personal views about the subject companies or issuers; and (2) that no part of the research analyst’s compensation was, is, or will be directly related to the specific recommendations or views in this research report.

Analyst Certifications and Independence of Research.

Each of the 22V Research analysts whose names appear on the front page of this report hereby certify that all the views expressed in this Report accurately reflect our personal views about any and all of the subject securities or issuers and that no part of our compensation was, is, or will be, directly or indirectly, related to the specific recommendations or views of in this Report.

22V Research (the “Company”) is an independent research provider. The Company is not a member of the FINRA or the SIPC and is not a registered broker dealer or investment adviser. 22V Research has no other regulated or unregulated business activities which conflict with its provision of independent research.

22V Research, LLC is a professional services and independent publication organization. 22V Research, LLC is not a securities broker-dealer, not a member of the Financial Industry Regulatory Authority (FINRA), not a registered investment advisor (RIA) and not a member of SIPC.

Securities transactions, when offered, are offered by 22V Securities, LLC through LPS Capital, LLC. Certain employees of 22V Securities, LLC are dually registered as securities representatives of LPS Capital, LLC or Analyst Hub Securities, LLC. 22V Securities, LPS Capital and Analyst Hub Securities are members FINRA, SIPC.

https://brokercheck.finra.org/

Current Ratings Definition.

SECTOR OUTPERFORM: An “outperform” rating anticipates the company will outperform the S&P Regional Banking Index (peer group).

SECTOR PERFORM: A “market perform” rating anticipates the company will perform in line with the S&P Regional Banking Index (peer group).

SECTOR UNDERPERFORM: An “underperform” rating anticipates the company will underperform the S&P Regional Banking Index (peer group).

Limitation Of Research And Information.

This Report has been prepared for distribution to only qualified institutional or professional clients of 22V Research Group. The contents of this Report represent the views, opinions, and analyses of its authors. The information contained herein does not constitute financial, legal, tax or any other advice. All third-party data presented herein were obtained from publicly available sources which are believed to be reliable; however, the Company makes no warranty, express or implied, concerning the accuracy or completeness of such information. In no event shall the Company be responsible or liable for the correctness of, or update to, any such material or for any damage or lost opportunities resulting from use of this data. Nothing contained in this Report or any distribution by the Company should be construed as any offer to sell, or any solicitation of an offer to buy, any security or investment. Any research or other material received should not be construed as individualized investment advice. Investment decisions should be made as part of an overall portfolio strategy and you should consult with a professional financial advisor, legal and tax advisor prior to making any investment decision. 22V Research Group shall not be liable for any direct or indirect, incidental or consequential loss or damage (including loss of profits, revenue or goodwill) arising from any investment decisions based on information or research obtained from 22V Research Group.

Reproduction And Distribution Strictly Prohibited.

No user of this Report may reproduce, modify, copy, distribute, sell, resell, transmit, transfer, license, assign or publish the Report itself or any information contained therein. Notwithstanding the foregoing, clients with access to working models are permitted to alter or modify the information contained therein, provided that it is solely for such client’s own use. This Report is not intended to be available or distributed for any purpose that would be deemed unlawful or otherwise prohibited by any local, state, national or international laws or regulations or would otherwise subject the Company to registration or regulation of any kind within such jurisdiction.

Copyrights, Trademarks, Intellectual Property.

22V Research Group, and any logos or marks included in this Report are proprietary materials. The use of such terms and logos and marks without the express written consent of 22V Research Group is strictly prohibited. The copyright in the pages or in the screens of the Report, and in the information and material therein, is proprietary material owned by 22V Research Group unless otherwise indicated. The unauthorized use of any material on this Report may violate numerous statutes, regulations and laws, including, but not limited to, copyright, trademark, trade secret or patent laws.