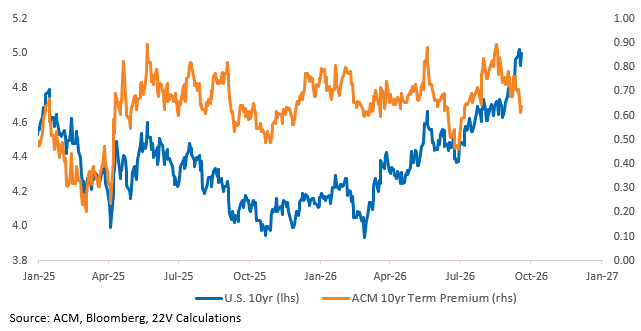
DAILY STRATEGY: A Quick Macro Mark to Market of our Call that the Fed applying mild restraint would not be a problem for risk assets, and it would lower bond uncertainty. So far so good. Since the Fed meeting, uncertainty in the bond market, based on estimates of 10yr term premium, is falling faster than the growth outlook, implying real EPS durability. 10yr yield remaining near the post FOMC highs, credit spreads tightening, the S&P moving higher suggest little change in the growth outlook. The growth and inflation outlook will slow and the sharp flattening of the yield curve is consistent with that call. The cross-asset view is consistent with a benign slowdown. The underperformance of small caps, the equally weighted S&P, Retail, and Transports make sense in that context. Some relief in small caps, retail etc., should be expected if oil prices move much lower, but we would not chase that move.
It is still an open question whether the slowdown in growth and inflation CONTINUES to take the benign easy path. Or the harder one. In the harder slowdown path, the Fed would hike even more than expected in an effort to ratchet back economic growth. The odds of that would increase of monthly Core PCE readings remain near +25bp MoM, the unemployment rate moves below 4% and GDP growth stays in the 3%+ range.
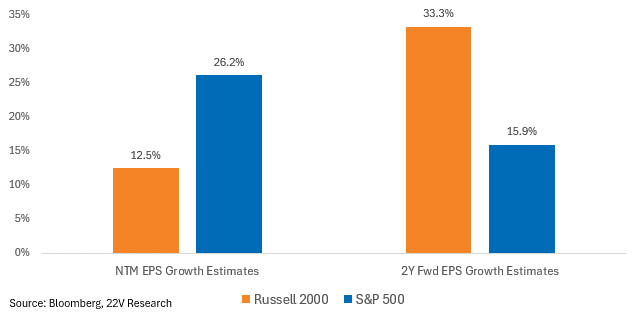
MARK TO MARKET SMALL CAPS: Small caps face headwinds from financial conditions tightening and growth slowing over the next several months. There’s an opportunity once inflation cools. Fundamentals for small caps are solid longer term. Large caps are expected to grow earnings ~2x the rate of small caps over the next twelve months, but consensus estimates show that reversing in Y2. Net net, small cap 2 year EPS CAGR (+22.4%) is greater than large caps (+20.9%).
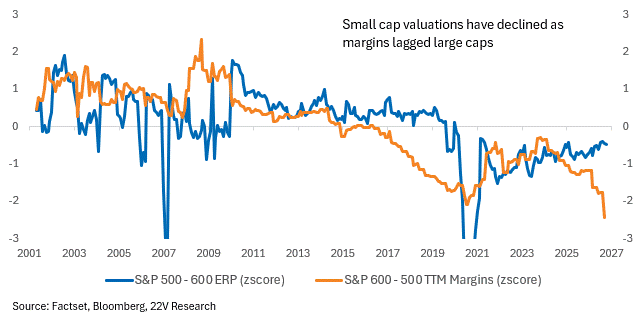
However, longer-term, small cap relative performance is largely a function of margins relative to large caps. The valuation spread, using our preferred cash return discounting method*, trends in regimes over time, tracking margins. This year, the margin spread has widened by another 1.7pp, in favor of large caps. Small caps need to close this gap to meaningfully outperform for an extended period (details on potential magnitude below). AI tools being employed by small caps, to close the margin gap with large caps, would lead to significant upside in small caps.
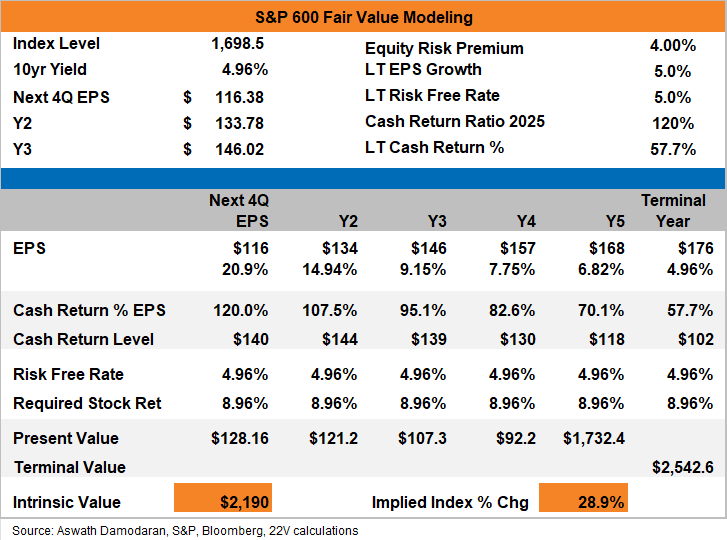
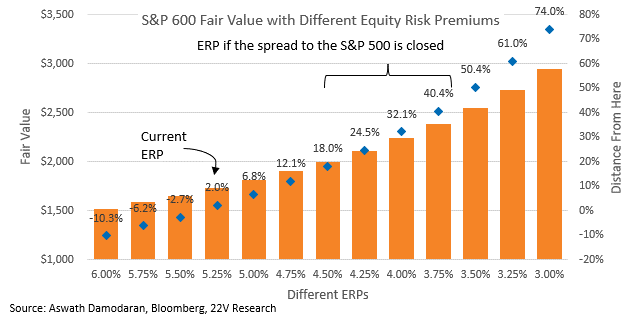
We can use fair value modeling to provide estimates for upside IF small caps can close the margin gap. Fair value increases mechanically with a better eps path from margin growth. For every 1pp of margin growth, small cap fair value increases ~10%. Upside would also come from a new valuation regime. When the margin gap relative to large caps was smaller, the small cap ERP moved in a range of ~0.5-1 point less than the large cap ERP. Bringing the current ERP in-line with the midpoint of that historical range increases fair value by +30%. It would be false precision to pick a single historical margin and ERP point to target as we move towards a potential new margin regime, but the practical implication is that fair value would be significantly higher IF small caps closed the margin gap and valuations followed. Consensus estimates imply analysts do not view this as a likely outcome.
*Our preferred valuation methodology, based on the work of Aswath Damodaran, valuation guru at NYU, discounts futured cash returns (dividends + buybacks). It is akin to valuing an index using a DCF for a single stock (good resource HERE).
Charts…
10yr term premium has declined significantly as 10yr yields stay near recent highs. Suggesting less uncertainty in 10yr government bonds, but a still relatively firm economic growth outlook.
Consensus estimates are for small caps to close the NTM earnings growth gap in year 2.
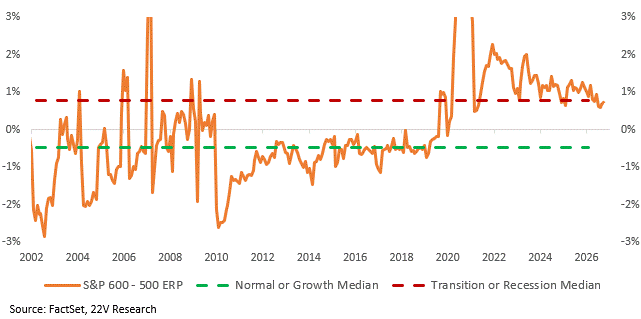
Small vs large cap valuations move in regimes. Targeting a pre-COVID valuation spread has not worked. The valuation spread is partly a function of margins. Net net, small caps need better margins relative to large caps for a durable rerating.
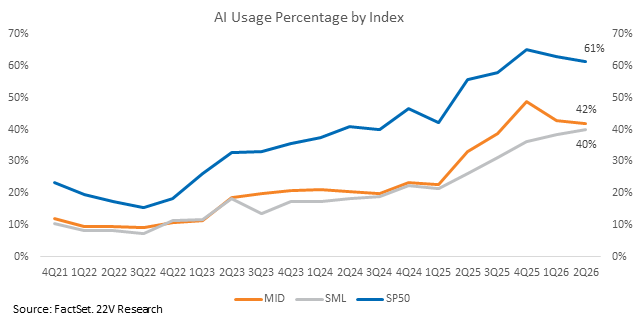
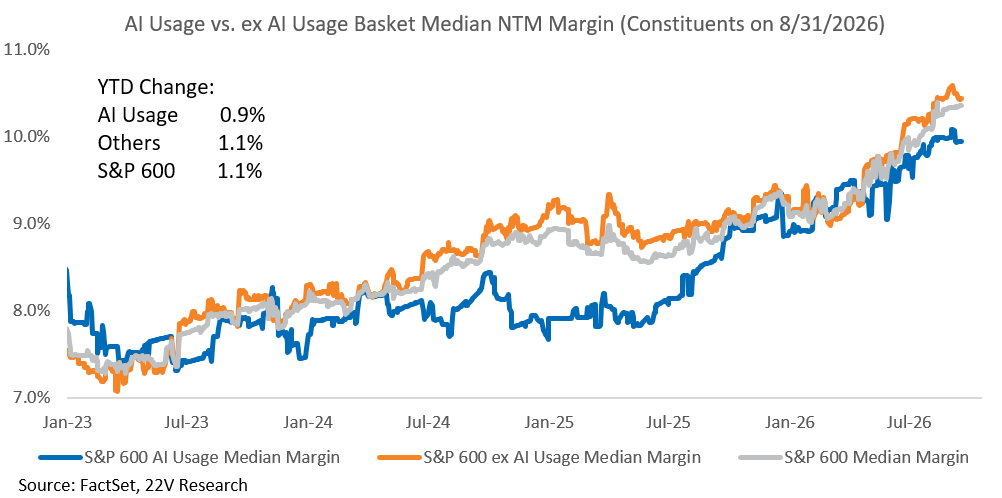
The most obvious potential upside to margins is AI. Implementing AI is boosting large cap margins currently (lots on that HERE), and large caps implemented AI faster than small caps, contributing to the widening margin spread. Last quarter, small cap AI usage narrowed the gap to large cap AI usage. That’s the good news. The bad news is that implementing AI has not had the same impact on small caps so far. TTM margins and NTM margin estimates are worse for small cap AI users than non-AI users, and forward-looking margin sentiment expressed by management teams of AI users has fallen to the same level as non-AI users. Long term performance hinges on whether or not small caps deploy AI with better results going forward. It is early to declare that a lost cause. Deploying AI has helped large caps, after all, and small caps have more room for improvement than large caps, in theory. We will be tracking this.
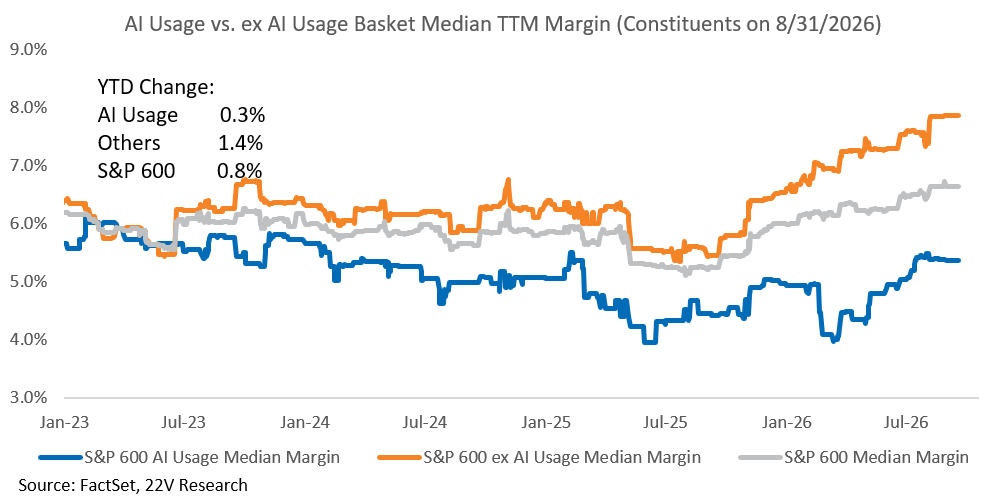
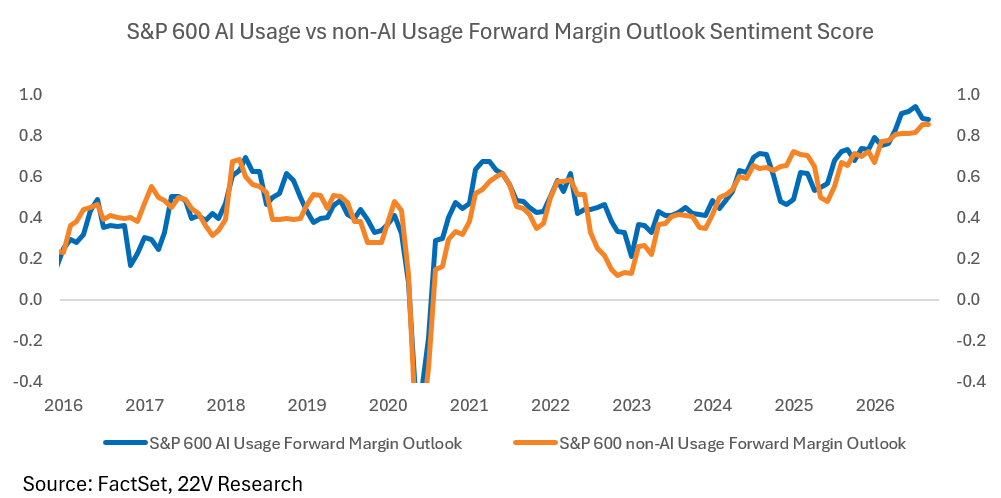
It is early to declare deploying AI a lost cause though. It has helped large caps, after all. IF small caps margins improve relative to large caps, and the ERP splits the pre-COVID midpoint relative to large caps, upside to small cap value is +30%. Do not get caught up with false precision here. It is hard to know what the margin spread will be if small caps, which are less efficient and theoretically have more room for improvement, successfully deploy AI. The practical implication is fair value is much higher for small caps if valuations rerate.