

It has long been obvious that the Excess Savings Stock (ESS) thesis is fatally flawed. It fails to recognize that fiscal expansions are always financed by net financial saving somewhere, and thereby identifies as unique to this episode something that is utterly mundane. It misses that housing and durable goods consumption boomed while households were presumably retrenching. It mistakes bank deposits for “savings” and assumes that fiscal expansions influence deposit growth, rather than the distribution of deposit growth. Relatedly, it misses that deposit growth earlier in this decade was driven by QE and was therefore not concentrated at the low end. And it commits this last sin by measuring deposits across the various income cohorts via medians, rather than means, which causes it to miss the huge gains at the upper end – driven by QE. I have documented all these points in earlier notes and will confine myself here merely to listing.
The ESS’s main virtue seems to be that it provides banks occasion to parade their Big Data while pretending to care about income distribution. Message: We care! Also, some Wall Street libertarians seem to like alternative data as somehow more legit than what is produced much more rigorously by the public sector statistical mills. I have in my mind Jim Cramer with his studious face on eagerly assuring the bank CEO that he “has the data, yes.”
Facts getting in way
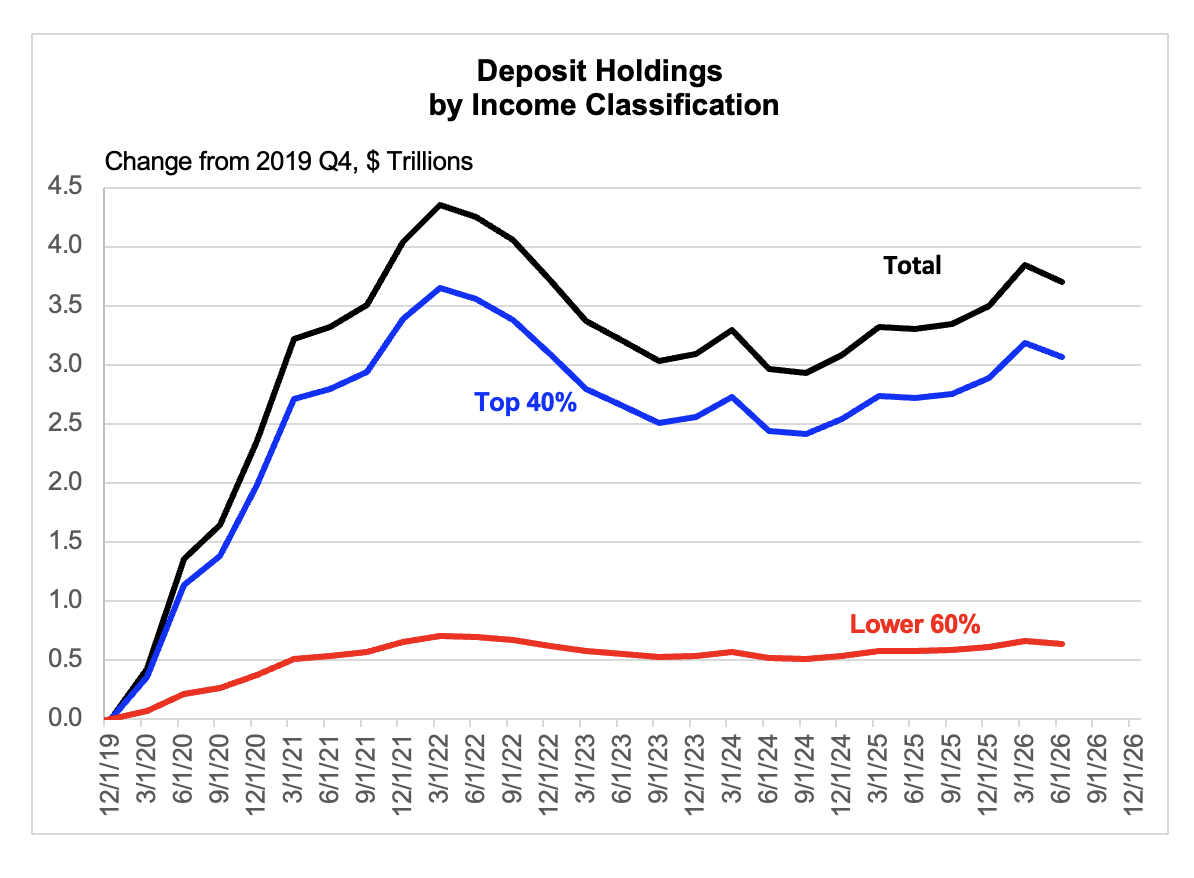
Data are actual to 2026 Q2.
In any event, the ESS was back in the news last week because one of the commercial bank chiefs reported that earlier “rumors” that (low end) consumers were running out of excess savings have turned out to be false. There is some irony here because this chief’s bank was one of the two main proponents of that rumor and spreaders of the misinformation alluded to above.
But there is a sense in which the reference was timely, because on Friday the Fed updated its Distributional Accounts through the second quarter. And they allow us to take a less distorted and comprehensive look at the pattern of deposit growth during this decade. To be clear, the Distributional Accounts are imperfect, because they involve interpolations of the pattern of financial asset accumulation (across income and wealth cohorts) between a triennial Survey of Consumer Finances. But they are far superior to the bank data in part because they measure averages or dollar aggregates, which – unlike medians – are commensurate with macro variables, such as consumption or the money supply, etc. Separately, there was a triennial survey conducted after the presumed accumulation of excess savings, so the interpolations are probably not a major issue when it comes to the issue under consideration here.
The Distributional Accounts continue to show, unsurprisingly (because revisions tend to be minor) that deposit growth in the immediate wake of the Covid Shock and Biden fiscal stimulus was heavily concentrated at the upper end. This is no surprise because it was driven by QE, which the use of medians to measure distribution would tend to miss.
Separate from the QE-driven rise in the overall deposit stock, there was a slight and temporary shift toward the lower end that was in fact seemingly caused by the debt financed fiscal transfers. So, the story promoted by the banks was not strictly speaking false. It is just that its macro implications were severely overstated, and the main drivers deeply mistaken. For example, this was not a cause of the rapid growth in the aggregate deposit stock or, roughly, money supply. Nor could it have been. See Money and Banking 200.
The low-end deposit stock has not really fallen in absolute terms since the Biden fiscal stimulus — that was supposedly “saved.” LOL. However, it has fallen relative to overall nominal PCE, which I take as a rough index of nominal consumption at the lower end as well, lacking an alternative. So, in this very practical sense, low end “excess savings,” as misconstrued by the consensus, has indeed been burned off. It is just that the concept is utter nonsense and entirely non-predictive, especially of overall consumption, which is driven inevitably by the upper end, as always.
Actually, they have burned it off in the only sense that might matter — but does not really
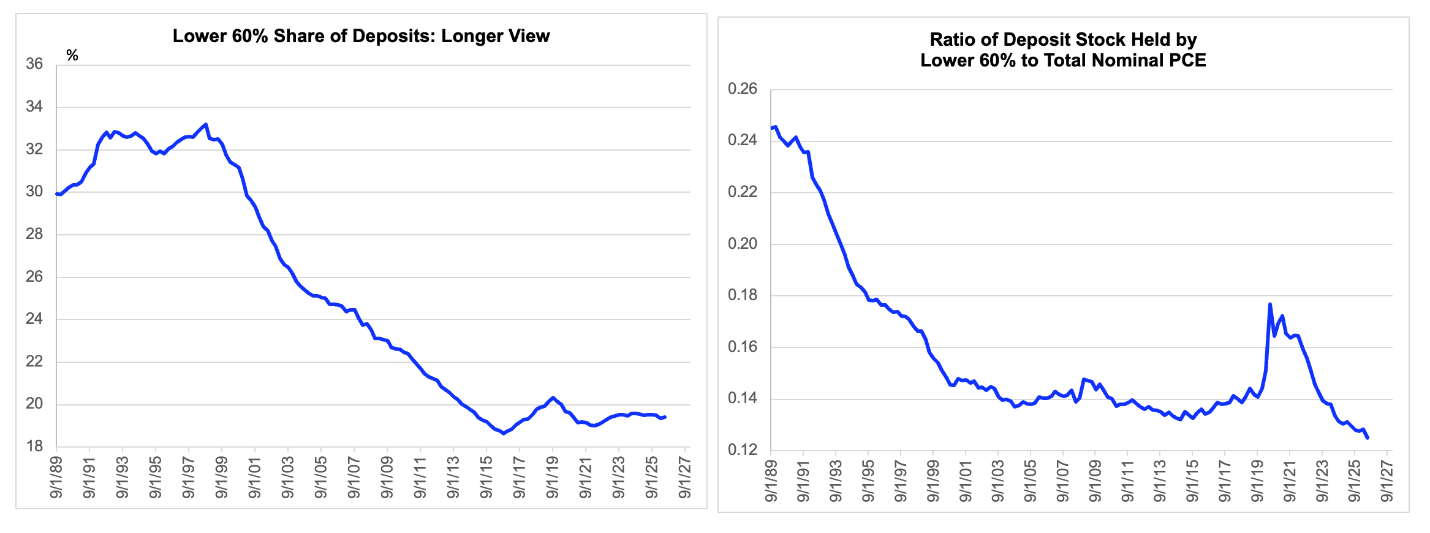
Data are actual to 2026 Q2.

