

My note yesterday focused on how the stabilizing influence of the large fiscal deficit maps to financial trends in the household sector. I led with that because the mapping there is quite straightforward. While household sector deleveraging appears to have ended, leverage is much reduced from its pre-GFC peak and the household sector is not dependent on rapid credit extension to finance its current pace of spending. So, this remains a case of an absence of fragility, on my reading. Relatedly, there is little evidence that credit availability is about to tighten, although I did not get into that in my note. You may have noticed it was in the news.
The mapping from developments in the nonfinancial corporate sector is a lot less straightforward, in large part because granularity is much more important there. As I will quickly review below, the aggregate data from the Financial Accounts for the second quarter, released on Friday, show that on balance corporate sector financing needs are quite limited. However, there is obviously a large gap between what is going on among firms involved the AI infrastructure buildout and in the rest of the corporate sector, which would seem (oddly) to be in a rapidly expanding financial surplus.
We know that AI-related borrowing has risen from near zero a couple years ago to a pace of perhaps $600 billion in 2026. That is only 4% of the stock of corporate debt a couple years ago, so it does not really move the needle much for overall corporate debt supply, a point that is often overlooked by alarmists. But I concede that concentration matters here. And there is also the issue implicit debt growth in the form of leasing, which definitely has the look and feel of vendor financing. As you know, the numbers there are quite large, daunting, and not well assessed by an analyst whose toolkit is macro variables. So, you won’t see me pounding the table here.
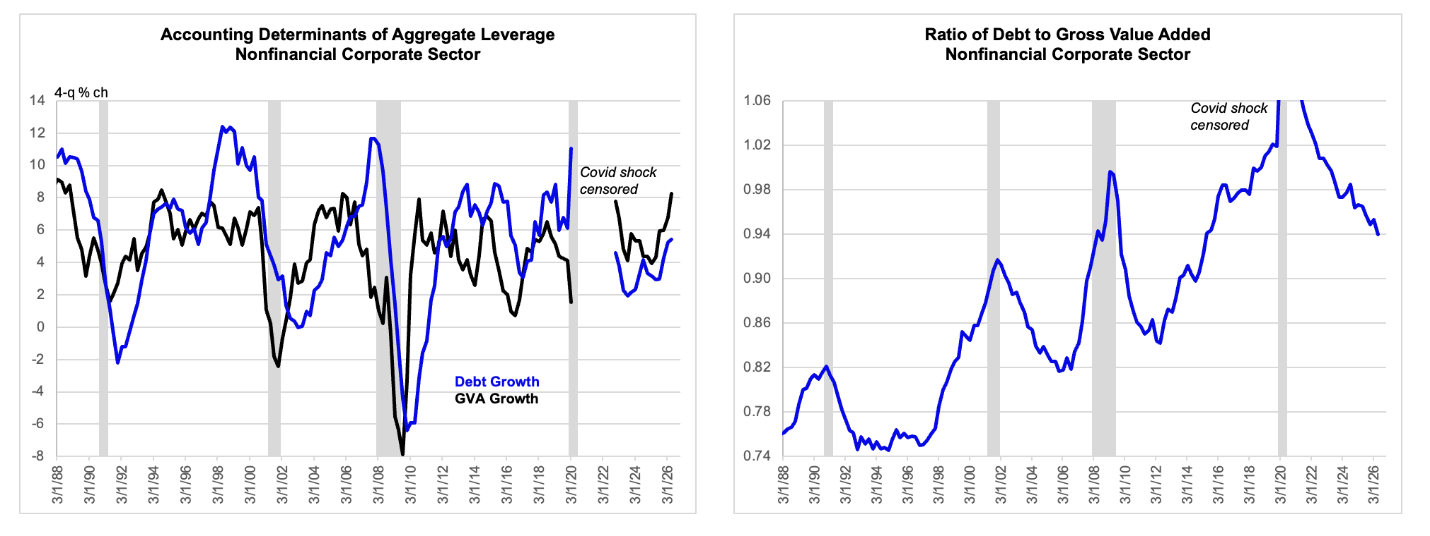
Data are actual to 2026 Q2.
Still the data from the Financial Accounts are quite interesting and perhaps even surprising; and I figured I should complete the thought from yesterday. From the interim low five quarters ago, corporate debt growth has quickened by just over 200 basis points to about 5 ½%, which we might consider about normal. However, the gross value added of the corporate sector has also accelerated, to a very strong pace of 8 ¼%. And a result of this, the ratio of corporate debt to gross value added, the simplest measure of leveraging, has continued to fall steeply. Such rapid growth in the denominator is obviously not sustainable, because it involves a large inflation component which is intolerable to the Fed, as we will probably see in the announcement tomorrow. And the near term prospect for the denominator would seem to be a further quickening. So, this deleveraging seems fated to end soon. But for now, the macro trends here seem unalarming, the important AI complexity aside for a moment. Incidentally, the corporate sector ex-AI must be really deleveraging, which does fit the fiscal angle I have been emphasizing.
Debt growth is closely linked to the financing gap, which is defined as the difference between capital spending and internally generated funds. However, the link is loose because there is slippage created by swings in the pace of corporate sector financial asset accumulation. And it is conceivable that such asset accumulation, in the form of prefunding capex, might lead to a rise in the financing gap.
But it is interesting that the financing gap remains negative, in large part because of the recent surge in corporate profitability. And this obviously contrasts very sharply with the situation in the 1990s, when there was a widespread excess of capital spending, reflected in a record positive financing gap.
I should mention that the way the financing gap is measured involves a bit of complexity that I should touch on briefly. There can be noise in the gap introduced by the interaction of profit repatriations and dividend payments, which were a big issue late in the last decade, and for which I make some subjective adjustments in the chart below. Separate from that, gross saving was affected by the Covid related transfer payments in 2020 and by the tariff refunds in 2026 Q1. I correct for that within the measure of gross saving and it maps to the financing gap directly. I also correct for an odd spike of capital spending in 2022 whose source I have not tracked down. The purpose of these adjustments is to remove noise that would otherwise detract from the main point. Having said that, there is no adjustment for the latest quarter, Q2, and the adjustment for the tariff refunds is pretty defensible. So, the general impression left by the chart should be a fair depiction of the underlying reality, at least as measured. The bull spin here would be that the financing gap in the AI space seems for now at least to be small enough not to be dominating the overall picture. That is worth something, but – again – I need to concede that granularity counts for a lot here and that others have better access to and understanding of the data involved there.
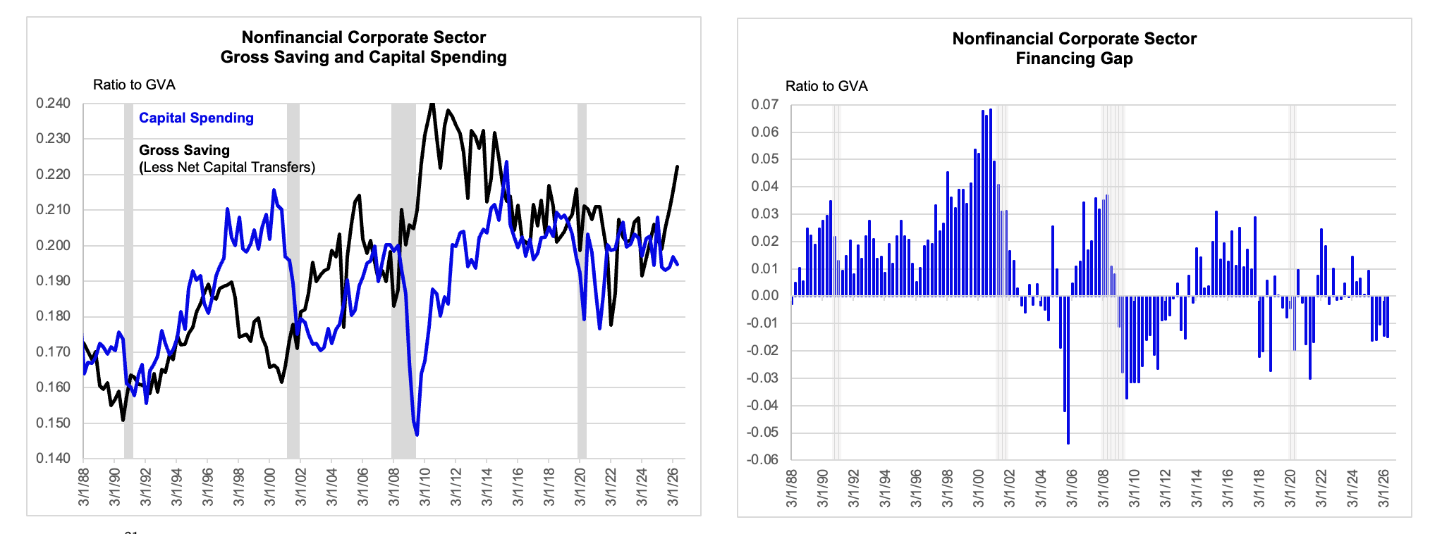
Data are actual to 2026 Q2.

