

Main point: The tie goes to the dove when thinking about the implications of recent declines in the aggregate employment / population ratio and labor force participation rate. And that does support a marginally constructive take on the recent evolution of the speed limit that the Fed will impose on GDP growth. But the September rates decision is a different issue, because short-term Fed calls have become somewhat arbitrary. And I would take seriously the point Nick Timiraos made in the WSJ today. This boils down to the July inflation data being released tomorrow. So, let’s be sure to read them properly!
On Friday, I mentioned that the steep declines in the employment / population ratio and labor force participation rates over the past couple of months could not be dismissed as just measurement error, safely ignored. On the weekend, I reiterated that claim, while conceding a separate point — to the hawks, in this case. It is possible, although not my central case, that the decline in these ratios is consistent with a tightening labor market. Specifically, if all the decline in the labor force participation were structural, reflecting say demographics or early retirement, then the lower employment / population ratio would not indicate increasing slack in the labor market. Instead, the much better measure of labor market tightness would be the unemployment rate itself.
My own central case is that the labor market has eased somewhat. And this is based on two considerations. First, it is probably not right to assume that abrupt movements of these ratios are being driven by structural trends, which tend to accumulate slowly. And second, there is the matter of the arithmetic involved here, which awards the tie to the dove. It would not be sufficient (for the hawk) to claim that most of the decline in the participation rate seems structural. If even a large minority share of that decline is cyclical, then the falling employment / population ratio implies at least some increase of slack.
I want to return to that point with some proper quantification here, because I noticed on the weekend that one analyst I admire has recently shifted from dismissing these measures as measurement noise and has shifted instead to arguing that that the decline in the participation rate is largely structural and that the labor market is therefore tightening, as evidenced by the lower unemployment rate. I am not sure this analyst is representative of a broader reassessment out there, because I do not see enough sell side research to make that call. But on the grounds that the analyst might, I want to weigh in briefly here with the relevant arithmetic.
The right panel of the chart below shows a history of the actual unemployment rate through April 2024, which is roughly when the participation rate began its most recent lurch downward. Beyond April 2024, I show various simulations of what I call the “effective” unemployment rate, which are based on various takes of how much of the cumulative change of the participation rate recently has been structural. If it has all been structural, then the path of the effective unemployment rate is equal to the path of the reported unemployment rate, which actually indicates tightening. In contrast, if none of the decline in the participation rate is structural, if it is all cyclical or a reflection of demand conditions in the labor market, then the change of the effective unemployment rate is proportional to the change of the employment / population ratio, which indicates easing conditions.
The purpose of the chart is to quantify my point that the tie goes to the dove. If the mix has been 50 / 50, then the labor market has effectively been easing. And even if the mix is 75 / 25 in favor of the structural interpretation, then there has not really been much tightening very recently, and there has been a lot of cumulative ease over the past year or two.
I think this point is worth internalizing and I do not want to weaken it by overstating it or its implications. Regarding the first caveat, the astute reader might notice that the employment / population ratio has been falling for quite a while now and then ask, so why the sudden focus? That would be a fair question and the answer to it is that the employment / population ratio and labor force participation rate fell steeply in June and then failed to recover much in July, despite quite confidently expressed claims among the hawks that the June data were just wrong. But I focus on the data for the entire civilian population because that is required to address the argument made by that analyst whom I respect.
The second caveat relates to the implications. I think even a slightly easing labor market should incline us to revise up our best guess of the speed limit that the Fed will impose on GDP growth going forward. And that is why I do not score the weak employment report for July as “negative” even though it was weak, when viewed through the lens of demand. (Demand is not the main worry here.)
However, we need to be careful not to link this argument, assuming it is right, to what the Fed will be up to in September. Indeed, that was the point on which I concluded in my note on the weekend. I see that Nick Timiraos has a piece in the WSJ today arguing that Fed decision in September will be largely determined by whether the July inflation data, which begin getting released tmorrow, with the CPI, come in hot or cold. I think Nick is probably right about that, in part because it is his job as a Fed watcher to be right about such things. With the reaction function unclear, we need to watch Fed speech related to what they will do, rather than backing into what they will do on the basis of our read on the data. And this is particularly true at short horizons. So, I would take seriously Nick’s main point.
Relatedly, when paying extra close attention to the CPI tomorrow, please ignore the headline figure, the core figure and even the upper level detail. Instead, pay attention only to what the underlying low level detail imply for the best guess of the Core PCE Price Index and its more relevant slices. I always emphasize that we should do this, and I figure a reminder here this afternoon might be timely. Good luck on that!
Tie goes to the dove here
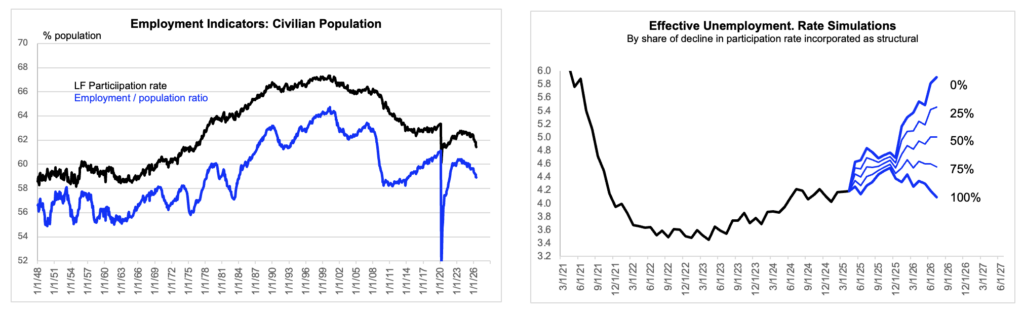
Data are actual to July, although the simulations are in most cases analogous with counterfactuals, as discussed in the text.

