

Since roughly the Covid shock, there have been two major forces pushing for a higher term premium (I will stick with the singular) in the US Treasury curve. The first has been a steepening of the expected path of the federal debt / GDP ratio. This influence works primarily through duration supply, rather than through concerns over fiscal sustainability. In order to convince markets to take down more duration supply, there must be a higher incentive to do so, in the form of a higher expected excess return to longer duration, which is literally what the term premium is. The term premium is not about something bad being expected to happen, as is often implied by popular discussion.
The second factor pushing for a higher term premium is a shift in the stock-bond correlation from an “ice” regime to something closer to “fire.” In the ice regime that held prior to Covid, apparently with increasing force, stock and bond returns are inversely correlated. So, adding duration to a portfolio of stocks actually reduced the volatility of the so-called representative market portfolio. And that, in turn, reduced the incentive required to convince markets to hold the required stock of duration risk. In a “fire” regime, in contrast, stock and bond returns are positively correlated, which means that adding duration increases risk requiring a higher excess return. So, duration has become more difficult to digest, just as the supply of it has accelerated. (Incidentally, this story can be told entirely without any reference to QE or QT, which was largely a distraction.)
One relevant question is what has caused the stock-bond correlation to switch. As I mentioned in a recent note on this issue, Campbell et al. have argued that the primary driver here has been a shift in the correlation between the output gap and inflation. In what I call a “fire” regime, an output gap (which is negative for stocks) tends to develop in the presence of an inflation problem (which is negative for bonds). I will not try to outwit the academics in their own work, but I would express what I take to be the same idea in perhaps more primitive terms, i.e., by getting closer to the primitives. And I see two deeper fundamentals here. First, we have escaped liquidity trap, which means that the risk of the economy sinking into a funk that cannot be mitigated by monetary policy has declined. And this has reduced the left tail risk. Second, we have recently had experience of high inflation and some concerns about central bank commitment to containing inflation. So, the right tail risks have increased in response to that. And when the predominant tail risks shift from left to right, we go from “ice” to “fire.” It would make sense that the correlation between the output gap and inflation would also switch during this transition. But I am more interested in what markets perceive and in what the main drivers of this change in perception have been. I would say escape from liquidity trap and recent experience of inflation are the drivers.
My own view is that the escape from liquidity trap is durable, especially with the rising federal debt putting sustained upward pressure on r*. So, there seems to be little risk of this influence shifting back toward “ice.” The inflation story is tougher. Much depends on when the Fed manages to restore the 2% inflation target. But I guess I can venture that this consideration is also unlikely to gap suddenly back toward “ice.” Meanwhile, the flood of duration supply continues, so the path of least resistance in the term premium should continue to be upward and that the yield curve will therefore tend to steepen – over time.
The reason I emphasize that caveat is that at short horizons the monetary policy cycle can create a wedge between the slope of the yield curve and the term premium. For example, 2s10s might flatten quite a bit even without the term premium, strictly construed as here, coming in. For example, if Fed policy turns in a tightening direction, then the expected path of the funds rate over a 2-year period might rise above its expected path over a 10-year period, even if there is no change of the term premium, again, strictly construed as here.
One issue here is that 2s10s slope is directly observable while the term premium must be estimated. And by most accounts it is done so with great imprecision. I am not qualified to comment on the strength or weaknesses of, for example, the ACM term premium. But by design, it is intended to separate out slope from term premium, primarily by modeling the slope as only one factor in the estimation of the term premium. Other principle components of the yield curve enter into the estimation of ACM as well. And if we suspend disbelief for just a moment, we can see an interesting development here. Note that the estimated term premium has been widening almost without interruption since the Covid shock, exactly as my admittedly qualitative speculations would imply. But the 2s10s curve itself has been heavily influenced by changes in the monetary policy backdrop, which relate much more to the inflation cycle than to the inflation regime, which among other things, influences the stock-bond correlation, which is itself one determinant of the term premium. For me, this fits. And it encourages me to stick with the take that the term premium will continue to rise and that the yield curve will therefore tend to steepen over time. But at short horizons, the term premium is not the main driver there. The main driver is the monetary policy cycle. Moreover, the so-called easy part of the call for a higher term premium is now behind us. Negative 100+ bps was quite anomalous. Almost positive 100 bps is much less so.
The term premium is not just the slope
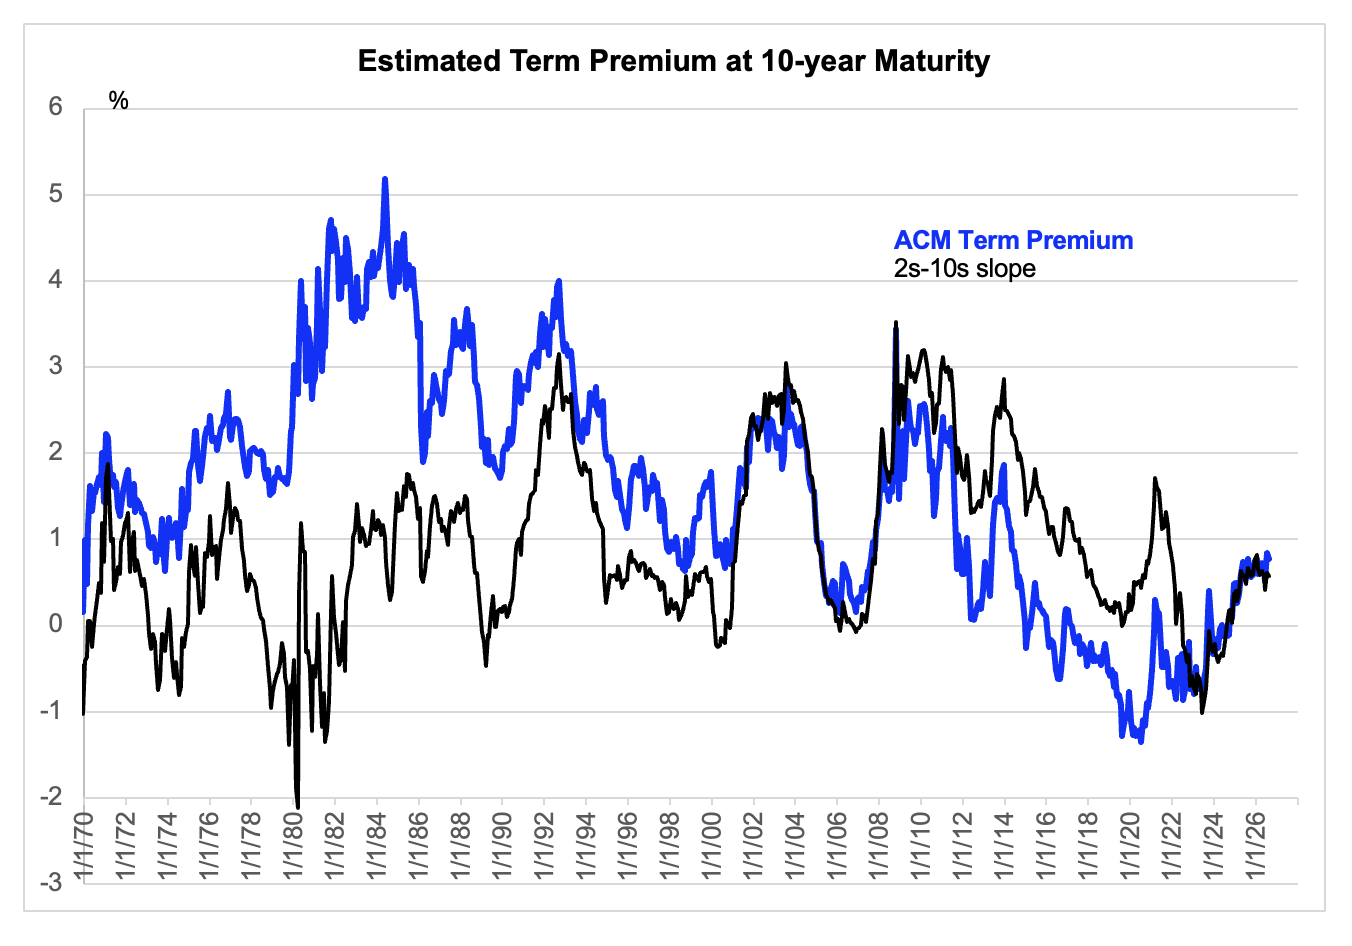
Data are monthly, except last which is August 6.

