

Main point: Much of what you read about sampling issues in the household survey strikes me as denial and a simple failure to apply Bayes. But we can argue about how much of the decline of participation rates is structural. If it were entirely structural, then the falling unemployment rate would be evidence that my take is wrong and that the labor market has been tightening. But even if much of it is not structural, i.e., cyclical, then my conclusion goes through. I concede there is room for debate on this part of the story.
I scored the July employment report as weaker and more dovish than expected for a few reasons, two of which ought not be controversial. First among the obvious, inclusive of revisions, employment in the establishment survey was 206k lower than expected, while the private component was 103k lower. I readily concede that the private measure is the more relevant, but government employment is not entirely irrelevant to the cycle.
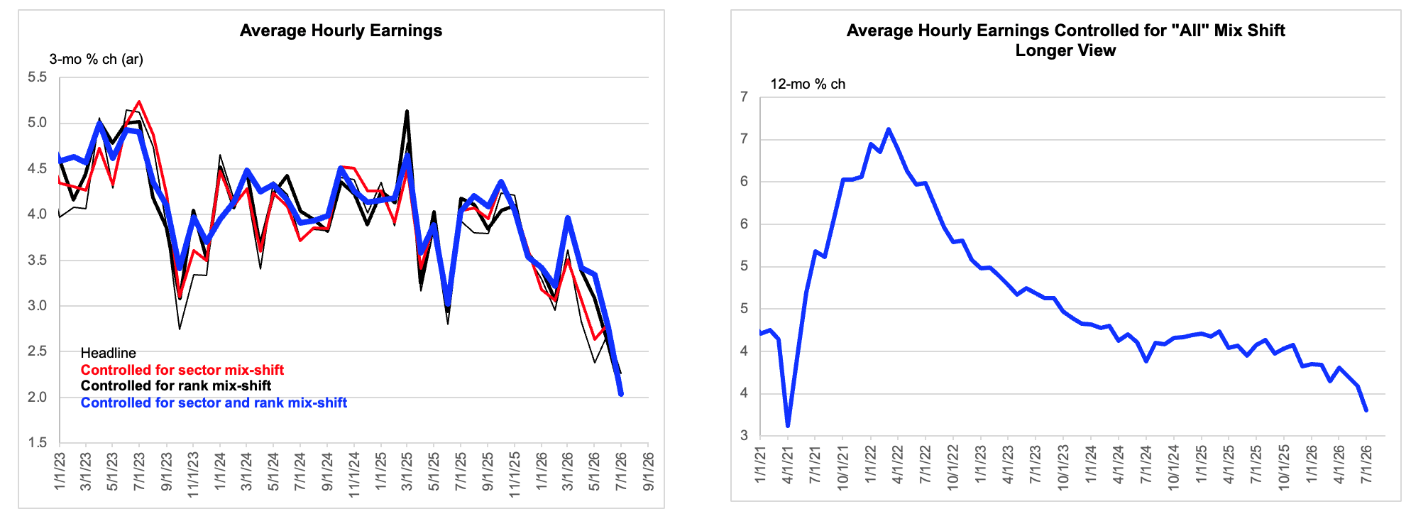
Secondly, the wage figures were quite weak, even after adjusting for sector and rank mix shift. Indeed, my proxy of wages controlled for these sources of distortion has been slowing slightly more steeply than the headline figure in recent months, and its rate of descent appears if anything to have recently steepened. One can tell a story of the labor market being tight and generating inflation pressure despite slowing wage growth. For example, increasing corporate concentration and market power, which widens normal profit margins, could allow for that result. Maybe, but when the new news is wage growth taking a steep header, you have to score that new news as dovish.
I would say this counts
Data are actual to July.
The data in the household survey are slightly more controversial. And on them, I have a high-conviction view and a low-conviction view. The high conviction view is that efforts to explain away the recent decline in the employment / population ratio as sampling error and the like seem like denial. The steep decline in the e/pop in June month was supposed to be sampling error that would certainly correct this month. And yet, the employment / population ratio fell yet again. And then we were told about the difference between the e/pop change among workers who remain in the sample month to month vs those rotating in and out. The latter showed a steeper decline. But if there is a reason to discount those folks it would relate only to the timing of the decline, not necessarily to the veracity of the decline itself.
And the same point can be made about the effect of the new population controls in January. They tell us that recorded decline over say the past year was not as concentrated in January as the raw figures suggest. But they have no systematic bearing on the cumulative decline over, say, the past year, because the population controls are on average appropriate to the year to which they are applied. I know people get this one wrong, because I once did.
So, the people who refused to update their perception factor in that the employment / population ratio looks weaker than it did are just failing to apply Bayes, which I would say is pretty obviously bad practice. But there is much room for debate around the question of whether the falling employment / population ratio signals a tightening labor market, given that the labor force participation rate has also been falling.
Indeed, in recent months the participation rate has fallen even more than the e/pop, allowing the unemployment rate to decline. Whether the labor market is effectively tightening depends critically on whether we judge the lower participation rate as largely cyclical or largely structural. I favor the idea that the labor market is easing for two reasons. First, if even, say, 30% of the decline in participation is cyclical, then it follows that the labor market has been easing. The tie breaker there, arithmetically, is not 50%. Second, there is the corroborating evidence from wages, as discussed above, although to invoke that here is double counting to some extent.
People understandably like to focus on the employment ratios from the household survey as applied to the so-call prime-age workers between the ages of 25 and 54. During June, the e/pop and participation rate here both fell steeply. And the news (evidence of weakness) during July was that the confidently expected snapback did not occur. Outside prime, we got a renewed bout of weakness, which highlights another aspect of this story that is at least debatable, but on which I have a take.
Well, down to The Villages
Data are actual to July.
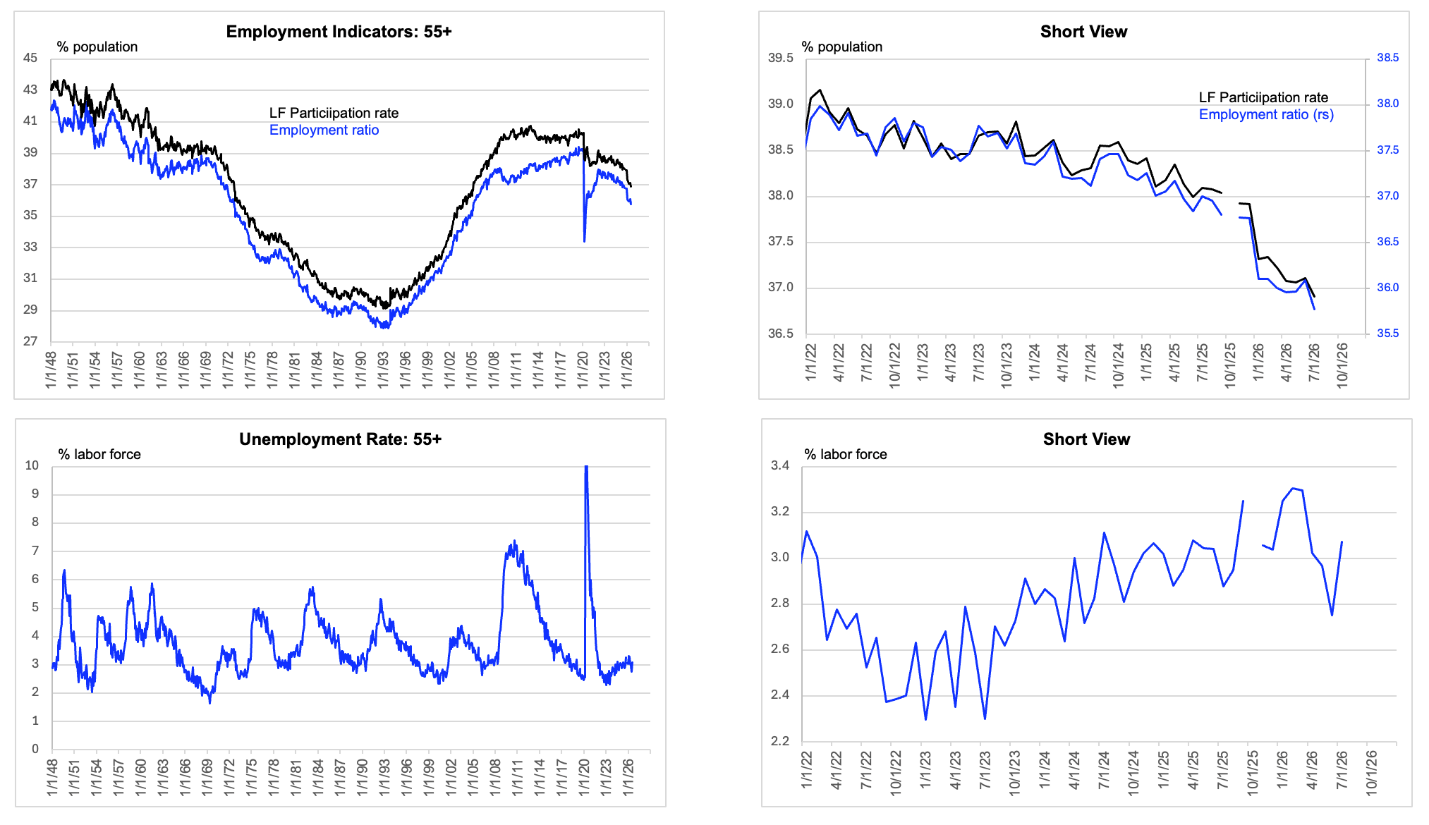
Both the e/pop and labor force participation rates have been falling among those aged 55 and above. And as it turns out, the “net” result of this has been little change of the unemployment rate But I put the term “net” there in quotation marks because I don’t think the unemployment rate is necessarily the best summary statistic in this context, because some of the decline in the labor force participation rate is very probably cyclical, and thus itself evidence of weakness. Demographics and the effects of the stock market do not likely generate such abrupt changes of participation. And the points I raised above about sampling and population controls apply as much to 55+ as they do to the overall figures. So, we can be skeptical of magnitudes and timing here, but to dismiss all this as measurement issues looks to me like a failure to apply Bayes.
So, that is my take. But I do concede that reasonable people might disagree with me on the share of the decline of the participation rate that is structural and thus how much signal I should take from the particularly steeply declining e/pop among my fellow oldsters. My judgment is that it cannot be mostly structural. But unlike the argument that the data are just wrong, that argument would seem to have some merit. So, I’ll mark the market reaction to date as possibly appropriate and move on. We will continue to learn about this issue as the new data roll in.

