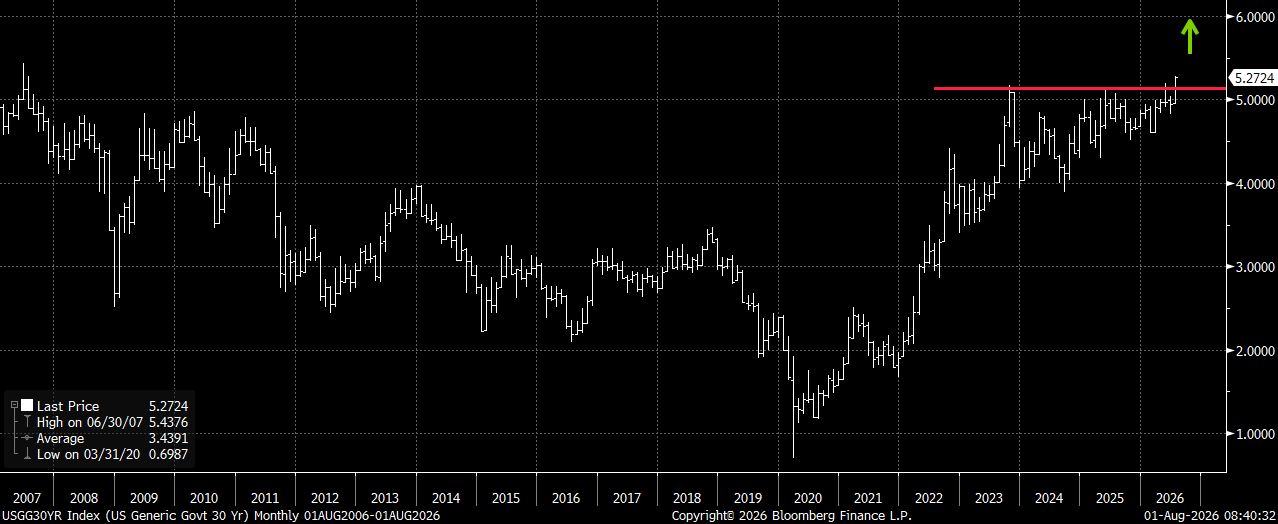
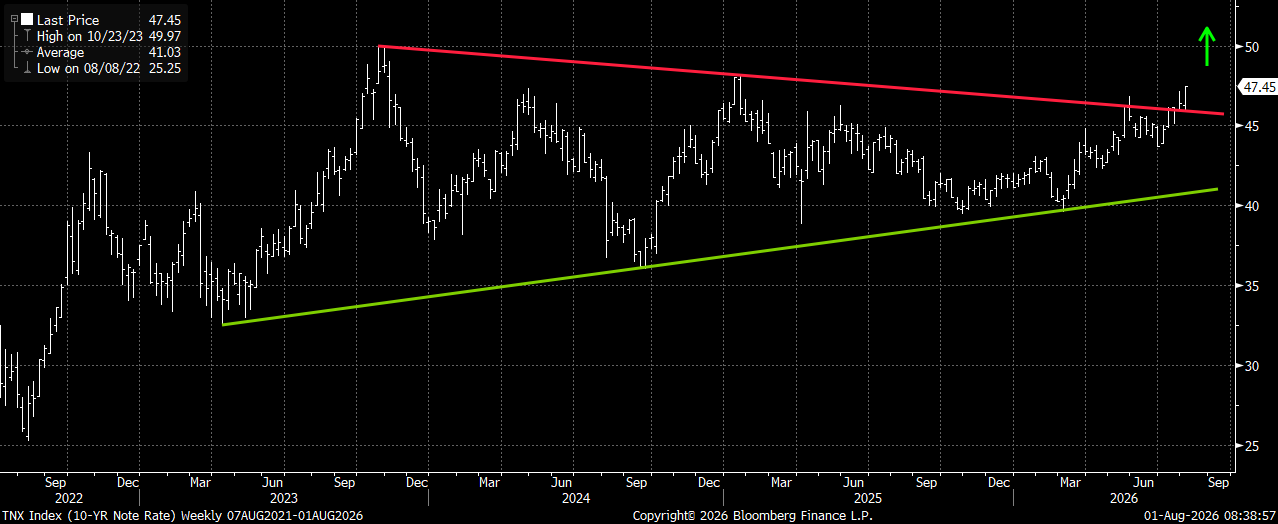
While much of the focus this past week by the equity community was on a certain AI hedge fund, I believe this distracted them from the potentially bigger story of the bond market. For the week, the 30-year yield moved up from ~ 5.16% to over 5.27% to close at a nearly twenty-year high. The 10-year yield also had another sharp increase, from 4.68% to 4.75%, and had a clear breakout above the recent 3-year range.
30-year yields broke out to highs last seen nearly 20 years ago
The 10-year yield finally broke out above the recent three-year consolidation wedge
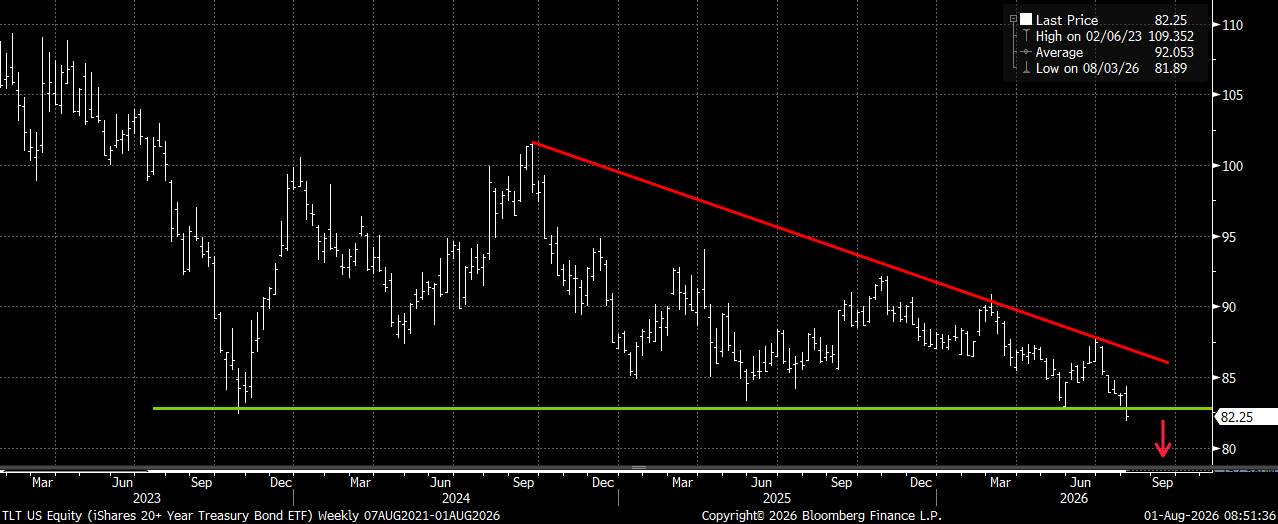
I have argued for some time that bond (TLT) implied volatility has been too low, and the recent moves back that up. Since March, we have now seen three declines in TLT of between 5% and 7% that all occurred within about a month. At an implied vol of ~ 12 (up from 9), the 1-month 40-delta TLT puts have only been pricing in a 1.5% move (clearly way too low given the realized moves since March). While vol has now moved up a bit to reflect the recent weakness/volatility, I still believe it should be owned to hedge further downside risk to TLT (upside risk to yields). Given the clear breakout in yields (TLT just made a new low), I would now look at October put spreads to hedge further downside risks to yields over the next few months.
Trade Idea:
Buy TLT Oct 16th 80/73 put spread for $0.95 (TLT 82.25 Fri close ref)
Trade Details:
- Buying the nearly 3-month protective put spread following breakout in yields this week
- Put spread starts a bit more than 2% lower (after factoring in dividends), and is capped to the downside 11% lower
- The 80 level in TLT roughly correlates to the 5% level on the 10-year (would likely be a pain point for bond investors and signal something is REALLY wrong)
- Trade offers a better than 6x to 1 max payout at October expiration and captures ~ 4 points of put vol skew
- Please contact me or the 22V sales team for updated pricing and execution capabilities
TLT has had three declines between 4.8% and 6.7% just since the start of March
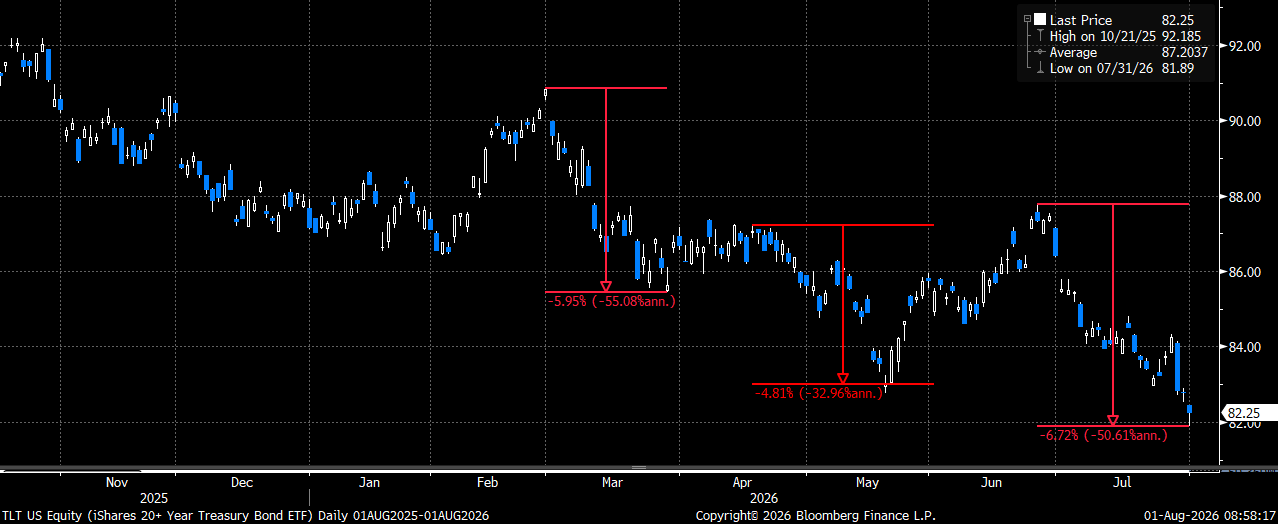
TLT with a break below the 2023 lows this past week
As for equity investors, while much of their focus has been on the recent momentum meltdown (and potential reversal this week), perhaps their focus should now shift to the bond market? While the move higher in yields has done very little to impact the strength of most of the market, it would seem that this move higher in yields across most of the curve (especially on the back end) is likely to start weighing on stocks sooner than later. What stands out to me specifically is the spread between where yields are and the “traditional” rate-sensitive areas of the market.
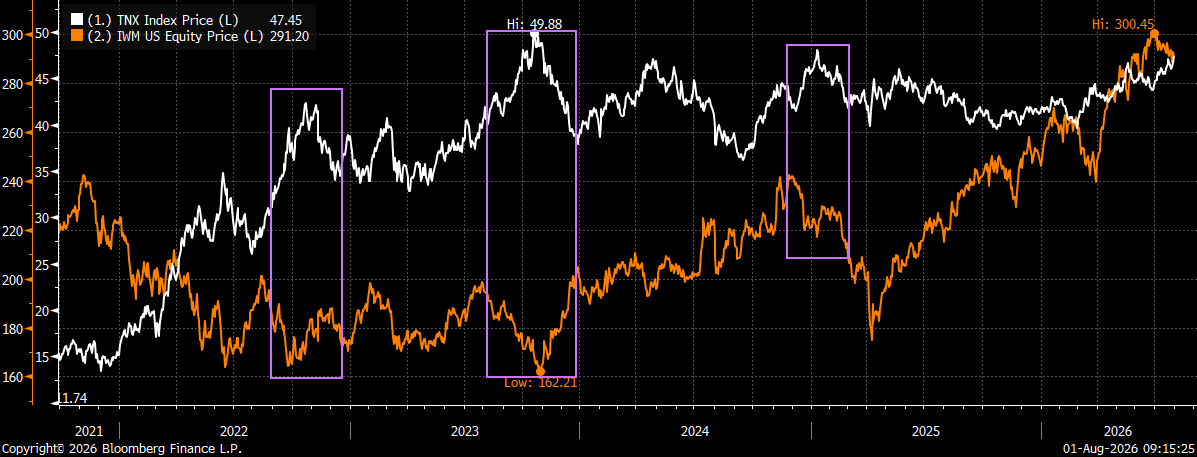
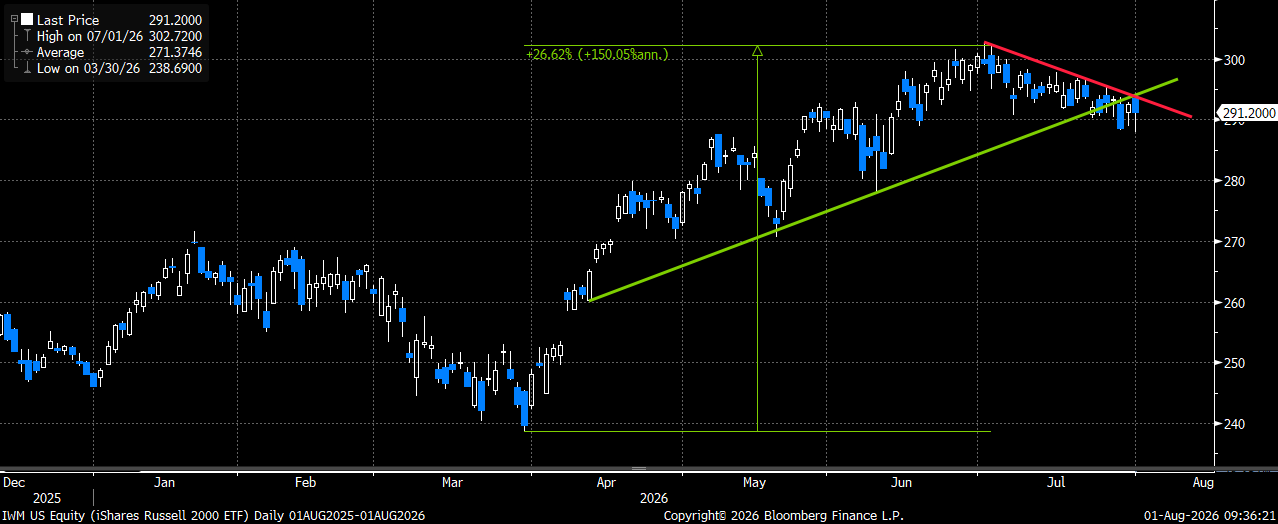
Small caps (IWM), for example, have held up remarkably well in the face of higher yields. We can see this clearly when we overlay 10-year yields to IWM over the past few years. On the previous times when 10-year yields spiked, like they have done now, we saw a decided pullback in the rate-sensitive small caps. While IWM is down about 3% from the highs, they don’t seem to be fully reflecting the risks of a sustained move higher in yields. Not to mention, they are coming off a 27% rally off the March lows as well and appear to have a fair amount of downside risk from here should rates stay here or move higher.
We saw sharp declines in small caps (IWM) when yields have spiked over the past few years
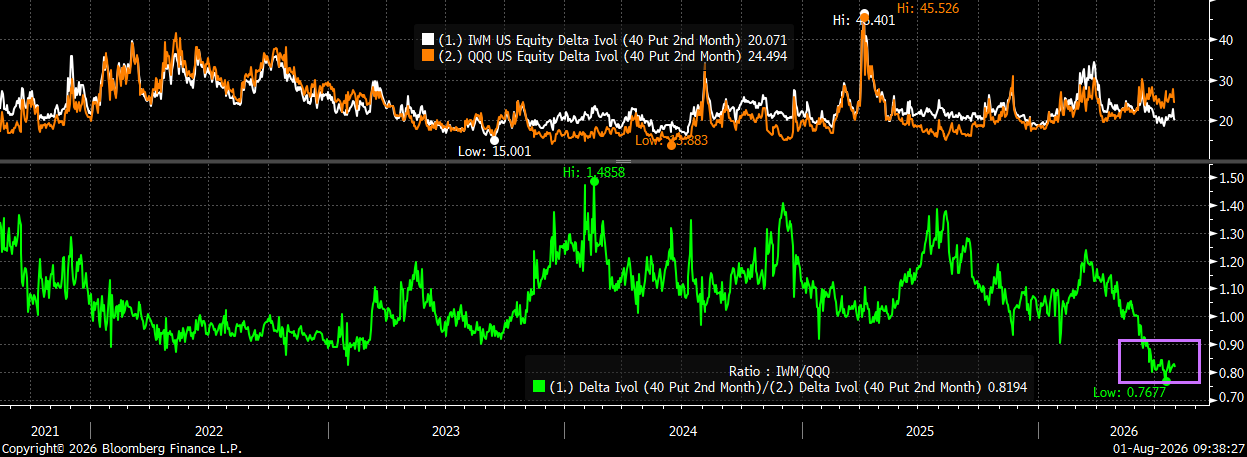
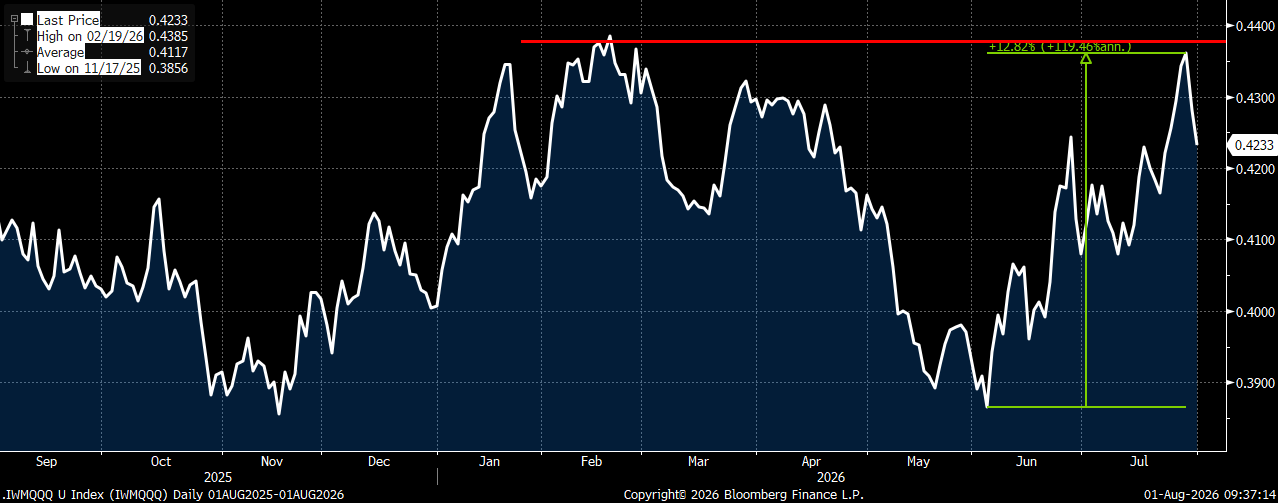
Besides the spread between where yields and small caps trade, there are a few other reasons why I really like IWM hedges currently. First, we just saw small caps sharply outperform tech (QQQ) as the AI/momentum trade was coming under pressure. Perhaps they were the main beneficiary of money coming out of that sector and being deployed to other areas of the market? In fact, the IWM/QQQ relative spread rallied ~ 13% from the June lows to the recent highs, which was just below the levels that the spread reached in February before moving lower (as yields climbed). Second, not only is IWM put volatility back near the 1-year lows on the 2-month 40-delta puts, but IWM puts are trading at their cheapest vol skew to similar delta/duration QQQ puts. Given the outperformance we just saw from IWM to QQQ, and the fact that they should be more impacted by this rate move, IWM hedges should be considered for all equity portfolio hedges in my opinion.
Trade:
Buy IWM September 18th 287/260 put spread for $4.90 (IWM 291.20 Fri close ref)
Trade Details:
- Buying the September (7-week) protective put spread hedge in small caps following sharp rally off the March lows and risk of a pullback due to spike in yields
- Trade starts just over 1% lower, and is capped to the downside more than 10% lower and below the 200-day moving average support and at the April gap higher support level
- Trade offers a 4.5x to 1 max payout at expiration, while capturing attractive put skew (Selling 25.5 vol vs buying 19.5 vol)
- IWM put vol trading at 5-year lows to QQQ put vol, another reason I favor owning small-cap equity hedges for any size portfolio
- Please reach out to me or the 22V sales team for updated pricing and execution capabilities
IWM rallied nearly 27% off the March lows to the July highs, and has been able to break above the recent downtrend
IWM/QQQ relative spread moved back to the Feb highs as money rotated out of tech on the AI/Momentum unwind trade
IWM 2-month 40-delta puts are trading at their cheapest skew to QQQ 2-month 40-delta puts in over FIVE years