

Main point: The AI debt boom is best assessed with company level data. What I attempt to achieve in this note is to get us focused on timing and to provide some help with scaling. $200 to 300 billion is not a lot of debt growth. What comes further down the road may be, but it would be unhelpful to jump the gun here.
I am not aware of all the details in the debate between Torsten Slok and Michael Burry over the incipient boom in AI-related debt issuance. But there is one issue there on which I am inclined to side with Slok, especially from a macro (as opposed to debt index) perspective. It does not really matter what share of high-yield debt issuance is being taken by AI. To see this, just imagine that there was one dollar of high-yield issuance that happened to be offered by Oracle. What matters, from this angle of the story, is whether the debt growth is excessive, including in high yield.
To get a handle on this, we probably need a bit more granularity than is available from the macro data, so I have it on my to-do list to get in better touch with the company level data. In the meantime, I would like to offer a couple thoughts here that relate to timing and to scaling; that is, to the question of whether, say, $250 billion is even a lot money.
Let’s start with the issue of timing, which will be a familiar theme to anyone following my commentary on this issue – even as a “tourist.” We often hear that the aggressive capex plans of the AI leaders, especially the hyperscalers, imply a massive surge of debt over the next few years. I saw a story recently suggesting that the capital markets might ultimately have to take down $7 trillion of AI-related debt, which is indeed very scary. The basic premise behind this projection is that capital spending having just risen above the internal funds of the companies involved will continue to explode higher, as cash flow lags well behind.
But that describes a future scenario that may well not be realized, in large part because it is so scary. The consensus sense of where we are right now is that AI related debt growth might run in a range of $200 to 300 billion during 2026. That is a decent jump from just two years ago when supply was running at about $50 billion, although most of the acceleration happened in 2025 rather than this year, if the projections are correct. But you might wonder if that is a lot of money.
The short answer is that AI-related debt issuance is no longer trivial, and this does fit into my view that it is no longer wildly premature to worry about excess in this space. I would keep an open mind that the impetus to aggregate demand growth from the AI buildout might begin to abate by as soon as 2027. But let me see if I can provide some history and macro context around this estimate.
The debt boom associated with the TMT cycle during the last 1990s is estimated as having involved about $500 to $600 billions of debt growth, which was in retrospect enough to end in tears, in the debt markets as in equities for somewhat separate reasons. During 1998, which was roughly the middle of TMT debt boom, gross value added in the nonfinancial corporate sector was just over one quarter what it is today. So, scaled to the size of the corporate sector, the TMT issuance was closer to $2 trillion in today’s dollars. Accordingly, the comparison – for today – would be roughly $250 billion this year vs just over $2 trillion back in the late 1990s. Of course, that surge was spread over a few years, and we can debate whether the correct metric here would be annual flow or cumulative. From where I sit with the information I have in hand now, I would say this wave still looks fairly small when observed through the prism of debt growth. The scale of the capital spending upswing itself, which has to date been largely internally financed, compares more closely with the TMT wave. Indeed, I would guess that as of right now it is slightly larger. Separate discussion. By the way, if you think I am missing hidden debt growth, please do yell at me and with links.
As mentioned, the best way to assess this story is probably at the level of the company data, aggregated to suit our purpose, rather than through macro data. But I happen to be more familiar with the macro data and they do have the advantage of being consistent across time. They are also comprehensive, which is a double-edged sword. We don’t want to miss anything, but we also don’t want our focus diluted.
In aggregate, there is no comparison with the last GPT wave
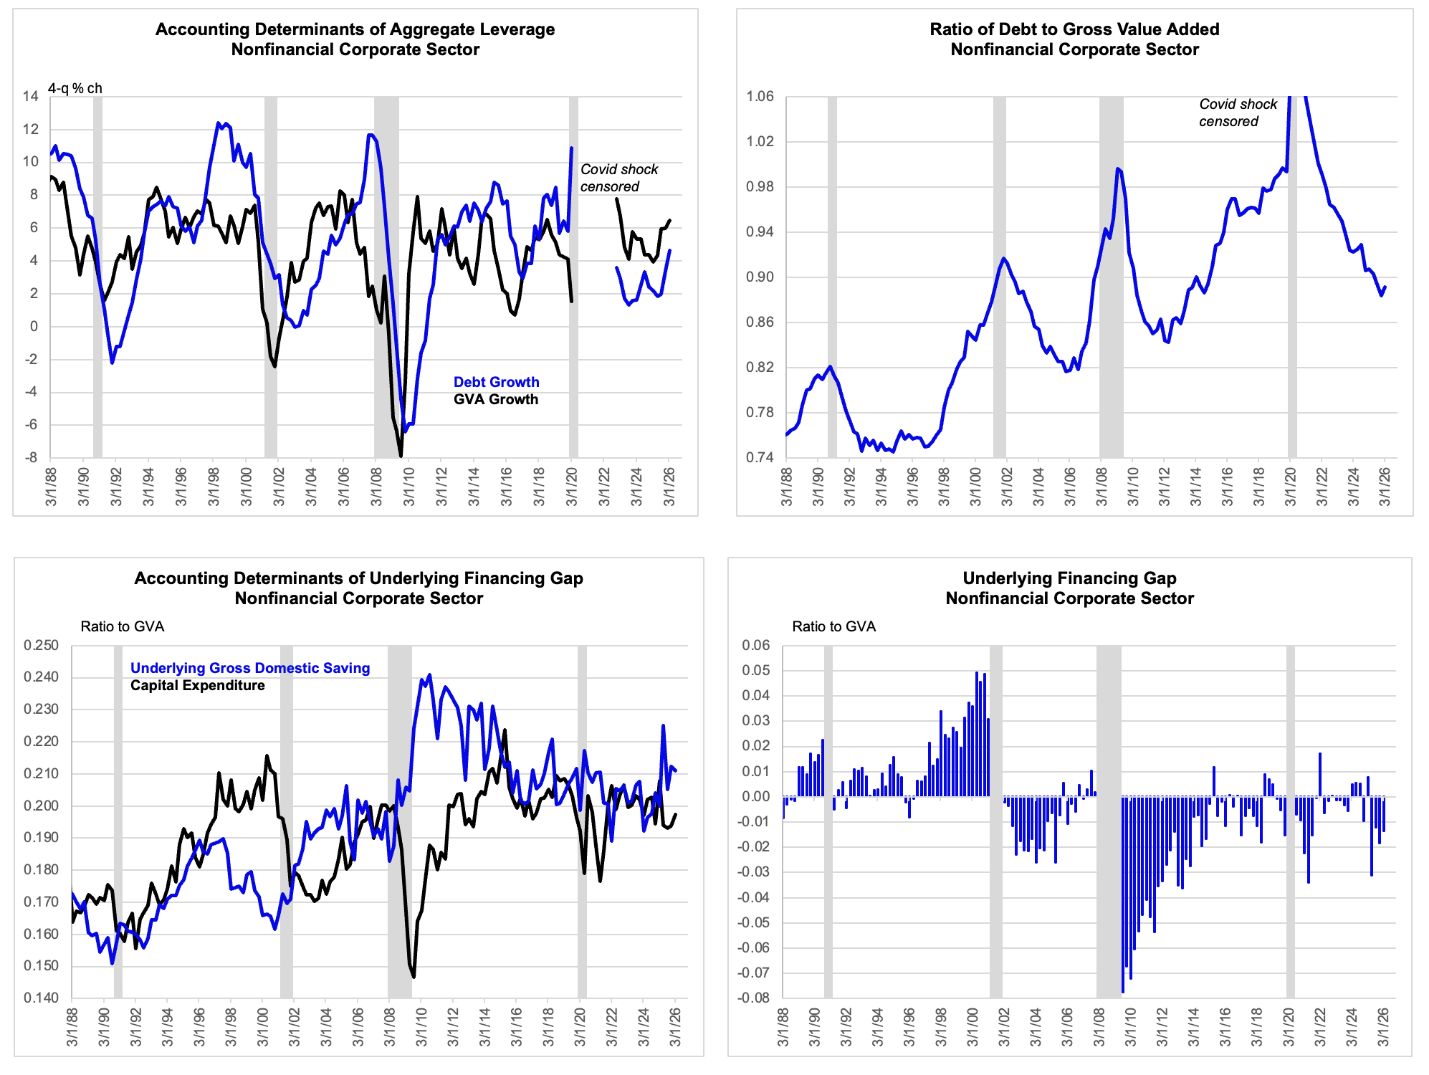
Data are actual to 2026 Q1 and cleaned up as discussed in the text.
In any event, I spent the morning tidying up my presentation of the major debt trends in the corporate sector, now that this issue has become more immediately relevant. In particular, I spent a bit more time cleaning up the data on the corporate sector’s underlying financing gap, which is a quite important construct but one that is reported with quite a bit of noise.
Let’s start with how overall debt growth in the corporate sector in early 2026 compares with the overall debt growth during the TMT boom. Debt growth is running at just over 4% during the four quarters to Q1, which compares with 12% debt growth during the TMT boom. And the ratio of corporate debt to gross value added has accordingly been collapsing, rather than booming. So, from this perspective, there is no comparison. I should add that the first quarter was somewhat against the recent trend, because debt growth was quite rapid during that period taken in isolation. So, this bears watching, but jumping the gun would be a mistake as well.
The corporate sector financing gap tells a story that is – unsurprisingly – very much in line. And it is here that I have chosen to change my presentation slightly. The financing gap is defined in the Fed data as the difference between capital expenditures and internally generated funds, where the latter are defined as after-tax global profits net of capital transfers, dividends and profits retained overseas. And I clean up this presentation in a few ways to remove distracting noise. The first adjustment is to stop netting out capital transfers on the grounds that their trend value is around zero, which means that occasional spikes or reversals there are mostly a source of noise. For example, during the most recent quarter, Q1, net capital transfers were deeply negative, which forced up the Fed’s measure of internal funds and forced down the Fed’s measure of the financing gap. That is not helpful, so I just override that.
Dividends and earnings retained overseas are a different matter, because their trend values are far above zero. In this case, I just net out the volatility associated with arbitrarily timed dividend payments and repatriations. I leave the trend there intact, but net out the short-term vol. These adjustments are not such a big deal on balance between special dividend payments and repatriations tend to be correlated in time. But there is a slight net adjustment upward for internal funds and downward adjustment in the financing gap for 2022. Anyhow, the point here is to take out the noise, and that is achieved mostly by overriding the Fed’s netting of net transfers. I also impose a downward adjustment on capex for the first quarter of 2022, because of a weird spike then, even though I have not yet investigated the cause of that. This makes the financing gap looks smaller during 2022 than it otherwise would have. And that makes today’s negative gap look less remarkable by comparison. In other words, I am not cheating to strengthen my point here. I am just trying to surface underlying trends.
And the underlying trend here is that there is absolutely no comparison between the financing gap today, which is actually negative, and the record-wide positive gap during the TMT boom. I think it is fair to relate this to the AI story, at least to demonstrate that the AI boom, however overextended it may or may not be, is at least not yet dominating the trend in these macro aggregates.
Somewhat separately, the absence of a financing gap in the overall corporate sector does fit with my claim that the large fiscal deficit is stabilizing to the extent that it can allow aggregate demand to be sustained at a pace consistent with the Fed’s objectives for employment and price, without relying on bubble dynamics in the private sector, reflected in large financial deficits in the household sector and/or corporate sector. But that is an old discussion and beyond the context of this note.

