My take on the macro implications of the AI buildout has evolved a bit with the passage of time. I remain convinced that the consensus overstates the role of the buildout in aggregate demand growth. The perception gap here is not what it was. Just under a year ago, many people were taking seriously the false notion that almost 100% of demand growth was AI related. The numbers circulating now are, I think, 40% to 70%, which is less crazy but still high. I think a reasonable person could get to the lower end of that range.
I am less adamant that the AI boom is in its early days. A year ago, I would have told you not to confuse aggressive plans with excess already in place. But it is harder to say that the AI boom is not overextended relative to earlier General Purpose Technology waves, because the current wave is arguably already now larger than the TMT wave during the 1990s. And while the published capex plans remain aggressive, they do imply some dissipation of the demand growth impetus, starting by as early as next year. Moreover, there is tentative evidence that the major players here are starting to get more focused on actual, as opposed to hypothetical future, returns on their capex.
For reasons you will understand, my own seat puts me in a better position to monitor the first aspect of my macro take than the second. And I follow up along those lines in this note, with some additional analysis on how this story is adding to current aggregate demand growth. I have spent most of my time working with macro data from the National Accounts, but I have occasionally made reference to bottoms-up data, specifically from the so-called hyperscalers: Amazon, “Google,” Microsoft, Meta and Oracle. So, let me just quickly refresh what the consensus estimate for these firms implies about 2026. The consensus has their AI-related capex accelerating dramatically from the high $300 billions in 2025 to the high $600 billions in 2026. So, the increase is about $300 billion, which works out to just under 1% of nominal GDP. I am working with nominal figures here, but there is little need to convert to real because the nominal growth rate here is so high and adjusting it for inflation would have virtually no effect. (It would be otherwise if the $300 billion gain were on top of $4 trillion, rather than $400 billion.)
This bottoms-up measure of the impetus to aggregate demand is a bit higher than my analysis of the inherently-trailing macro data suggests, particularly when we factor in that the hyperscalers are not the whole story, although by most accounts they are the vast majority. But that is ok because this is meant to be a cross-check on those same macro data. Moreover, this analysis fits with the view that a hit to aggregate demand growth from this source is not imminent. I am happy to fade the 3-year outlook from the firms involved, but probably not the 3-quarter. (I bet Jensen Huang is wrong that we are headed to $4 trillion in 2030.)
Negatively correlated, especially recently
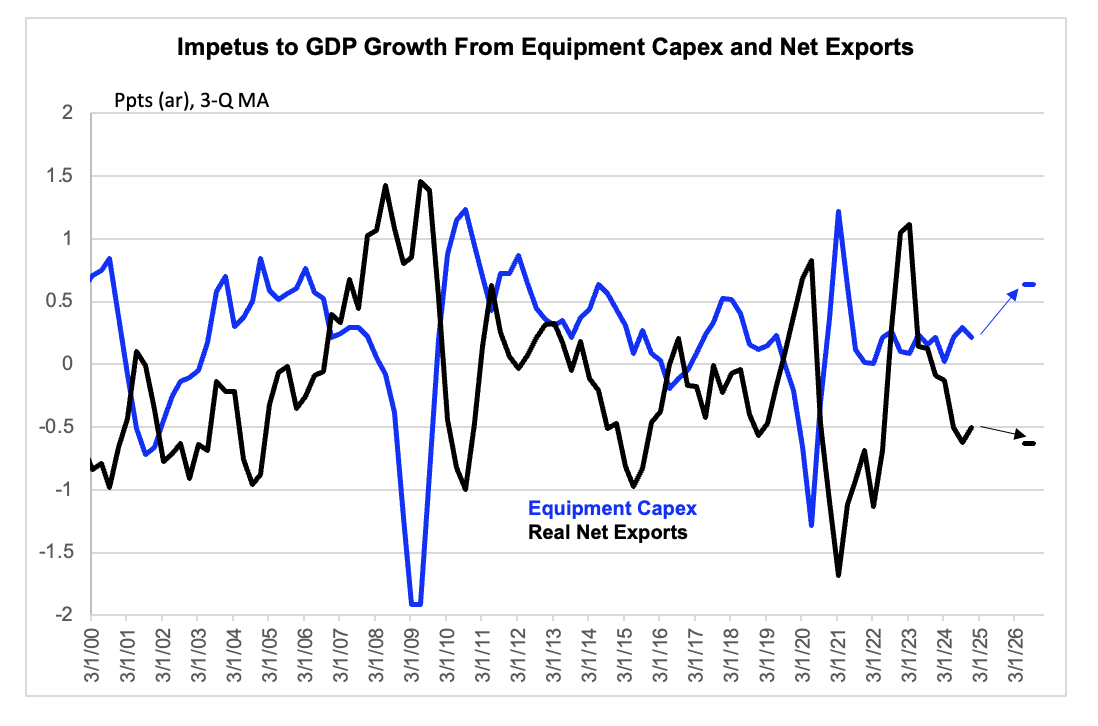
Unsmoothed data are actual to 2026 Q1 and estimated for 2026 Q2. Tariff shock period is censored, as discussed in text.
A key question is how much of this impetus is going to support aggregate demand growth overseas, rather than in the United States. In my most recent commentary on this issue, I documented that the drag on GDP growth from the swing in net exports in just two AI-related components, computers and semiconductors, was 2/3 of a percentage point on average during the two quarters ending in 2026Q1. The implication is that the surge in AI-related capex is being largely vented overseas.
I want to follow up briefly here on that claim in a way that is slightly more systematic and makes use of the BEA’s own measures of the add to GDP from various components of demand, which they produce in Table 1.1.2. I often point out that we need to do this sort of analysis using proper chain weighting, rather than via real dollar aggregates that systematically overstate the importance of AI, for reasons I need not reiterate here. I do my own chain weighting, but in this note, I would like to work with the BEA’s own figures just to eliminate any suspicion you may have around my calculation! The cost of this approach is that I need to surrender a bit of granularity, because the BEA produces these impetus figures only at high levels of aggregation.
Accordingly, the chart above shows the BEA’s measure of the impetus to aggregate demand (GDP) growth from overall equipment capex and net exports. The chart takes a couple liberties that probably should be explained. First, I measure the impetus on a 3-quarter moving average basis, because I want to be able to exclude the noise around the tariffs and have an estimate for 2026 Q2, i.e., roughly now. And the 3-quarter smoothing achieves just that. Second, and relatedly, I do exclude the tariff shock period which is just pure noise. Finally, I am not above drawing lines to connect the history to the estimate for Q2. Please forgive my chart annotation. I am not actually telling the data what to do, just connecting a couple dots.
The chart does seem to confirm a point I have been pushing, that much of this impetus to domestic demand is vented overseas via imports or – as measured – a swing towards deficit in real net exports. Indeed, there is a very fun coincidence here. I append the Atlanta Fed’s current estimates for 2026 to the BEA’s history to 2026 Q1. And when I do that, I find that the impetus from equipment capex is 63 bps (ar), while the drag from the net exports swing is that same 63 basis points. That is a fluke. The larger point here is that these two series are strongly inversely correlated, which is hardly a surprise.
One final point. When folks import chips from Taiwan, they create a trade drag that is larger on GDP (which I focus on here) than it is on GNP, which uniquely includes income from profits made by American firms overseas. So, the drag on GNP will be much less than that on GDP. And we can see an image of this in Taiwan’s macro data, which depict their GNP being well below their GDP. And given how high Nvidia’s margins are, this would not seem to be a case of just quibbling over details. It does not overturn my basic point, but it does make for an interesting wrinkle. I am not going to hit you with the single killer statistic on this stuff. I will continue to pursue the mosaic approach, which does seem to hang together here.
Sign of the Times