

The seemingly-consensus take that the June employment report was an odd one seems right to me. However, I think we can make life easier on ourselves and also be a bit more relevant if we focus on how the report should affect our sense of reality, rather than on issues internal to the report itself.
As I suggested on Thursday, a good Bayesian should probably shift to the left the probability distribution they have in mind describing the tightness of the labor market. They should also shift their sense of underlying employment growth to the left, although not dramatically. And the implication of these adjustments, taken in isolation, is to lower the odds of a nearby increase of the fed funds rate. What will actually happen to the funds rate will depend also on the path of inflation in goods and services markets. But an easier — or even less obviously tighter — labor market should be dovish for rates in isolation.
In this brief note, I want to get across two ideas related to the main point above. The first relates to how I would apply Bayes to the data from the household survey. And the second relates to the signal for the durability of the expansion from the data in the establishment survey. Collectively these ideas would support the claim that less hawkish does not mean slower – in terms of the growth outlook, which is determined mainly by the speed limit.
Being Bayesian
Let’s start with the applied Bayes. And please forgive me if this sounds sort of obvious to many of you. I am not above occasionally reminding people of the obvious. It is well known that at short horizons, employment growth is least noisily measured with the data in the establishment survey. The establishment survey data are subject to revision, which is well known – and probably gets more attention than it even deserves, because the first looks are not that bad. But adding in information on employment growth from the household survey does not do much to anticipate revision.
It follows closely from this that that the change of the employment / population ratio in the household survey does not likely tell us how much the employment / population ratio has in fact changed. The reason for this is that the assumptions about employment growth mapping the change of the employment / population ratio to the household survey measure of employment is not a major source of noise. The practical implication here is that short-term swings in the employment / population ratio are largely noise, not only as an implied cross check on employment growth as measured in the establishment survey, but also as a measure of slack. Analysts do not often emphasize this but it follows as a matter of arithmetic from what is generally agreed on.
Compounding this issue is that the employment population ratios applying to various age cohorts are even more volatile and contain an even larger ratio of noise to signal. For example, on Friday, the decline in the employment population ratio for June was concentrated entirely among prime age workers. Taken in isolation that might raise the relevance of the decline, given that the consensus tends to put a higher weight on prime age than the aggregate. However, within prime age, the decline was concentrated among workers aged 25 to 34 years. The odds that the employment / population ratio within this cohort collapsed as steeply as was recorded seem very low. That is mostly noise.
But I think it would be more helpful to recognize as obvious that these data are noisy on a month-to-month basis and to look at these data over a longer horizon and to update incrementally our sense of the signal from them on a month-to-month basis. And applying this approach to the June data, we see that the earlier concentration of the e/pop decline among non-prime-age workers seems to have abated a bit, such that the underlying trend in the e/pop now appears to be flat or declining across the various age cohorts.
And this declining trend looks to be a bit steeper than can be explained by structural forces. In other words, it suggests that the labor market has been easing. Or perhaps more precisely, the June update – focusing on the evolving trends, rather than the month taken in isolation – raises the odds that the labor market has been easing. I think most folks would agree with that take. The tougher question is what happened in June in isolation. I cannot answer that question. But nor is it important to.
The main demand side components are strong enough
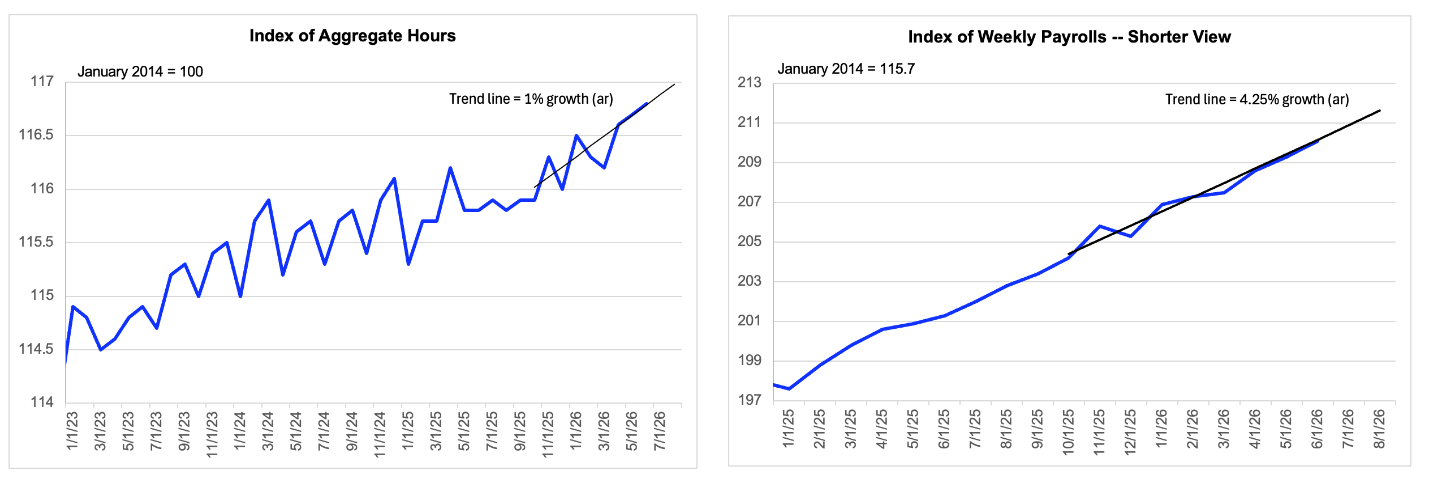
Data are actual to June. Please note that I show a shorter run of data on the right, because the short-term oscillations are much smaller relative to the trend in the case of the index of weekly payrolls, which means we should probably zoom in.
Return to the idea of the speed limit
The second point I want to raise here is not mostly about the labor market data, including how best to interpret them. Rather, when thinking about the medium-term outlook for growth, we should probably spend more time focused on the determinants of what I call (not unconventionally) the speed limit and less time obsessing about the state of this or that demand side indicator. The reason is that the Fed has room to cut rates if the demand side looks weak, and will do so if speed limit considerations allow them to do so. And importantly, the general absence of major real imbalances in the private sector lowers the odds of a sudden stop in spending growth, which raises the odds of the Fed’s last mover advantage here being dispositive.
I have been arguing that the speed limit, measured in terms of GDP growth, is probably 2% or slightly lower. This has worked ok, in the sense that the GDP has grown at an annualized rate of 1 ¼% during the first half of 2026. Core aggregate demand, measured as final sales to private domestic purchasers has been a bit firmer at 1 ¾%. For the purposes of assessing whether my take has been tracking, the truth is probably in the middle there somewhere, although for reasons I need not get into here. This has been tracking ok, although that is largely a fluke so far because speed limit considerations relate more to the medium-term than immediate outlook, because they act on Fed preferences.
The speed limit would tilt higher if inflation were to fall, if labor market slack were somehow to increase or if my best guess of productivity growth were to tilt higher. And vice versa. The point is that the recent employment data do little to tilt our sense of the speed limit lower. The falling unemployment rate might seem to do so, and I do not dismiss that. But on the balance of the evidence to date, as I read, it, that is offset by developments in the employment / population ratio. I may be mistaken, but I am not talking my book. Given the themes, I have been pressing this year, I am axed more to making the other argument.
Anyhow, what the labor market data say about the demand side of the economy are not the main point here. But just to complete the thought and to introduce at least some empirical element to this note, I would just remind you that the underlying trend in the index of aggregate hours is running at about 1%, on the establishment survey data updated through June. This reflects employment growth running at about 2/3% (ar) and a minor uplift from the trend average workweek ticking up from 34.2 to 34.3 hours. How we can describe the labor market as “easing” when employment growth is running above the estimated breakeven is a legitimate debate. Maybe the breakeven is a bit higher than the experts estimate. Or maybe private employment growth is overstated slightly. Or maybe both. But we don’t need to square all the circles. What matters is that the balance of evidence suggests that the labor market looks a bit easier now than it did several months ago and that the labor market is nevertheless strong enough to confirm that the central case for the expansion is that it is sustainable and that demand side worries are not most prominent here – with the Fed’s ability to ease being a bit of a trump card in that take.
The index of weekly payrolls, which I often call the “labor income proxy” is trending in a way that is also consistent with that take, although to repeat these demand side indicators are largely secondary from a speed limit perspective. Its trend growth rate is about 4 ¼%, which is consistent with real labor income growth of about 1 ¼% to 1 ¾%, depending on precisely we put trend inflation. This is not boomy, obviously, but it is strong enough to allow the speed limit, not demand, to be the binding constraint on the medium-term growth outlook. And the labor market data themselves have not tended to reduce the speed limit recently, although we will have to continue to watch inflation as well.

