

Main point: The old idea that the AI buildout – or an interruption of it – might deliver a major shock to demand growth and thereby trigger a higher recession risk remains unconvincing. With some confidence, I would continue to take the other side. Secondarily, recent developments suggest we might be a little more open minded about the impetus to GDP from this story abating and thereby weakening – at the margin – pressure on the funds rate path.
—
For the past ten months or so, I have been arguing that the risk of a sudden hit to demand growth from a correction of the AI-buildout was not pressing.
I raised three main points to support this claim. First, the idea circulating late last summer that the AI buildout was driving almost all GDP growth was demonstrably false. Adherents of this view failed to use the logic of chain weighting in their assessment of AI-related components of aggregate demand and thereby systematically overweighted the relevance of that demand to the GDP bean count, because relative prices have been falling in the AI and because the base period for the GDP bean count is quite stale. (Long story, told before).
Second, merely getting the weighting right is not enough because the hardware component of the AI buildout involves imports, which show up in capital spending but do not add to aggregate demand, i.e., GDP. As of a few quarters ago, using value added figures cut the contribution to GDP growth of the A-related spending in about half.
Third, there was grounds for “optimism” (or pessimism if you are a Fed dove) that the AI boom, whatever its contribution had legs, both because the cumulative rise of AI spending looked moderate relative to earlier cycles related to GPT waves and because the short-term leading indicators of the AI buildout looked robust. Some of the bears were freaked out that capital spending plans virtually guaranteed that an overbuild would develop. That might have been a valid point, about 2028, but when the AI leaders are planning to raise spending immediately, it might not be wise to expect them to cut it.
American firms sure are spending on AI related
Data are actual to 2026 Q1.
It has become less clear – from a rates perspective
The second argument still has validity in my view. If AI spending were merely to stabilize, as opposed to begin to contract, then my best guess of the hit to aggregate demand, i.e., GDP growth, would be about 40 basis points. That would not be a major issue for the expansion because ex-AI demand growth momentum is moderate, not weak, and because the Fed has rates to cut – and will cut them if macroeconomic prospects warrant that. Inflation may make the Fed sluggish to react, despite those upcoming PCE deflator revisions, which I don’t think matter much. But that means that the issue here is inflation, not the risk of a lot of impetus from AI. In this environment, the Fed has last mover advantage, by which I mean it takes incremental influences on demand into account.
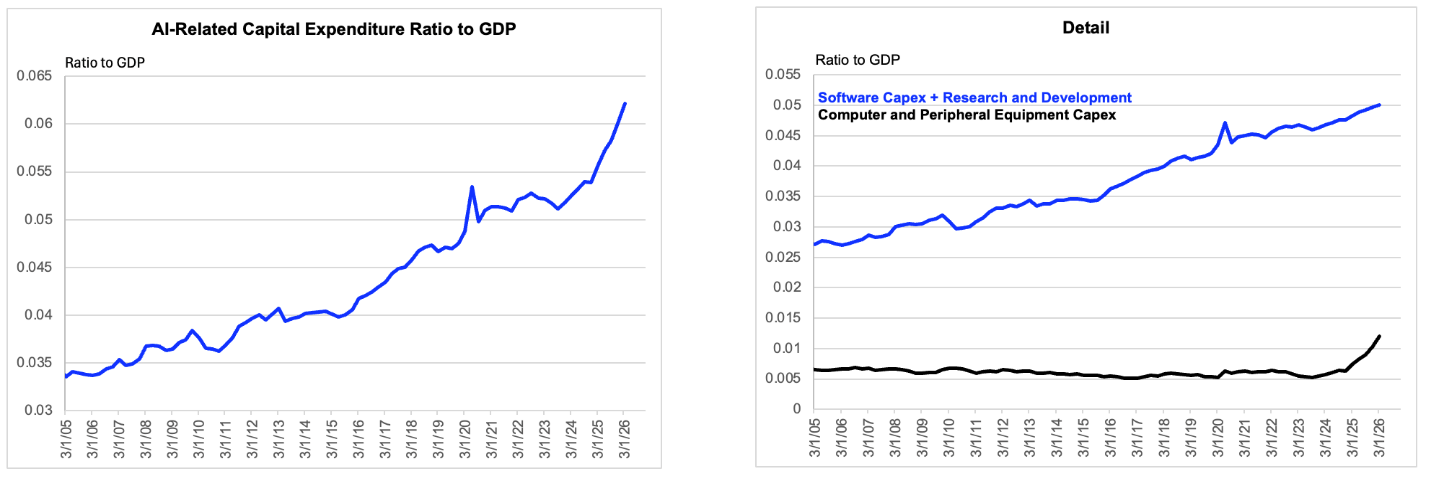
But the case for AI contributing meaningfully to demand growth over the next, say, two to quarters – and thereby tilting the Fed path itself in a hawkish direction has become a bit more ambiguous for reasons I will review in the remainder of this note. Let’s start with the expenditure side of the story, which makes no distinction between whether the source of demand is satisfied through imports or, secondarily, inventories. The chart above shows that capital spending in areas that might plausibly be related to the AI-buildout has continued to surge, as share of nominal GDP, over the past couple quarters, because of a pronounced upturn in computer and peripherals in recent quarters (which has not been mostly about price) and because intellectual property development in software and R&D has remained a juggernaut.
That is the good news from the backward-looking perspective. (And I should mention that the timing of this note is not really about fresh data in the GDP accounts on the expenditure side. Rather, the most recent vintage of the Q1 accounts gives us our first look at value added, which I will discuss below.).
The problem is that this spending cycle is not starting to look large relative to the most recent capex cycle related to a GPT, which was the 90s tech and telecom boom. Indeed, on my accounting the rise in the share of GDP taken by the usual suspects in this wave now slightly exceed that in the 90s wave, which was driven by commercialization of the integrated circuit and laser. And of course, if the recent boom continues, then the extent to which this exceeds the most recent example will widen. Taken in isolation, this proves nothing. Maybe the AI GPT is just more fundamental than were the integrated circuit and laser. That is one of many aspects of this story that are better assessed by experts in the technology than by a mere macro analyst. But with the passage of time, it has become difficult to dismiss those fearing an overinvestment cycle with a mere, pfff, don’t confuse aggressive plans with current excess.
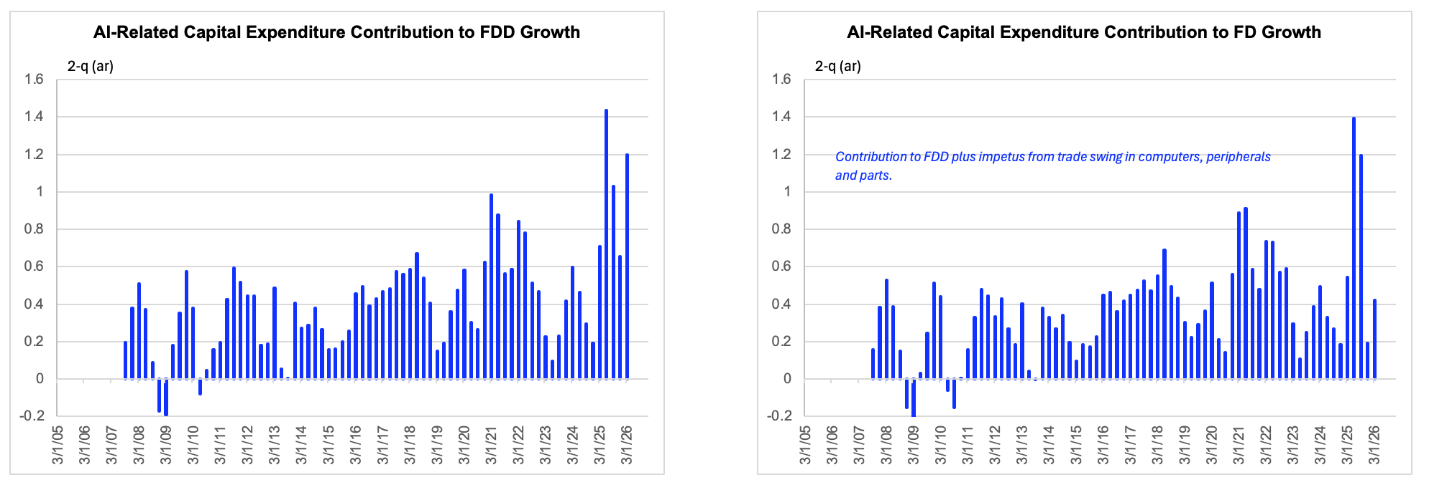
The role of trade (and to a lesser extent inventories) plays the role of a double-edged sword here, as alluded to above. Note in the chart immediately below that the two-quarter moving average of the contribution to final domestic demand growth from AI related capex was 1.2 ppts as of the first quarter. That represents two thirds of the 1.8% rise in final sales to private domestic purchasers, even using proper chain weighting. But note that this addition is cut to 40 basis points if we merely subtract out trade drag related to semis (obviously) and other computer hardware (more surprising) to me.
This is a double-edged sword in the following sense. On the one side of the blade, it is harder to dismiss the idea that this spending boom is looking extended. On the other hand, that might matter more for Taiwan, where GDP growth has recently been running at 14%, than for the US, because of the (US) import issue mentioned above. Headwinds against the boom are more plausible now, but the case against the economic expansion being just AI remains intact.
Adjusting for trade effects in just two items changes the story
Data are actual to 2026 Q1.
Americans do the thinking and hosting
Adjusting the impetus from the capex expenditure for the recent behavior of just two items from the trade accounts is meant to be suggestive rather than dispositive. Doing this properly is probably beyond my competence and certainly beyond my patience. Thankfully, though, the BEA produces measures of value added by sector, which (among other things) net out the demand that is satisfied via trade and inventories. Netting out trade is unambiguously a win, although the inventory side of it is more complicated. If a big slice of pulse to demand for US outputs comes out inventories, then netting that out would be a loss. So, let’s not assume we have more precision here than we do or assume that one simple readily-available measures tells the whole story.
Value added looks less perky very recently
Data are actual to 2026 Q1.
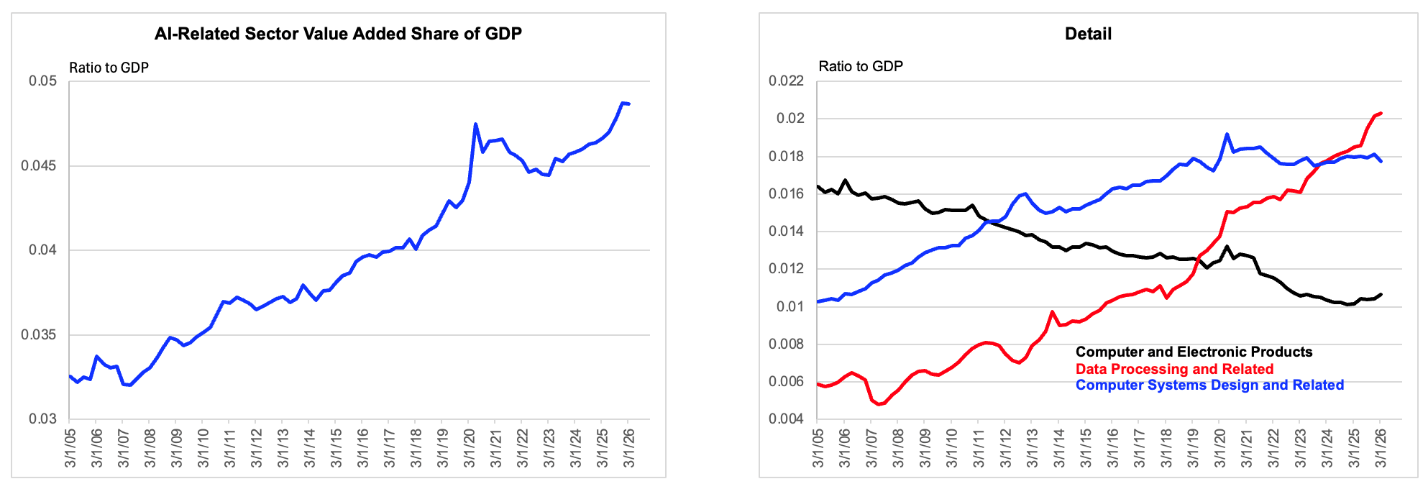
With that in mind, let’s take a look at recent trends in nominal value added in sectors that can be plausibly related to AI, as in the chart above. Keep in mind that the value added data in the National Accounts separates out sectors in a slightly different way from the expenditure data because they are looking at producers rather than spenders. In my view, this is an advantage in a sense I will get to below. Interestingly, the share of value added in nominal GDP contributed by the AI sectors actually ticked down during the first quarter, mainly because of decline in systems design. Data processing (including via data centers) continued to move higher but at a slower rate. And value added from the hardware side has recently turned higher, which – in this case – is largely about price.
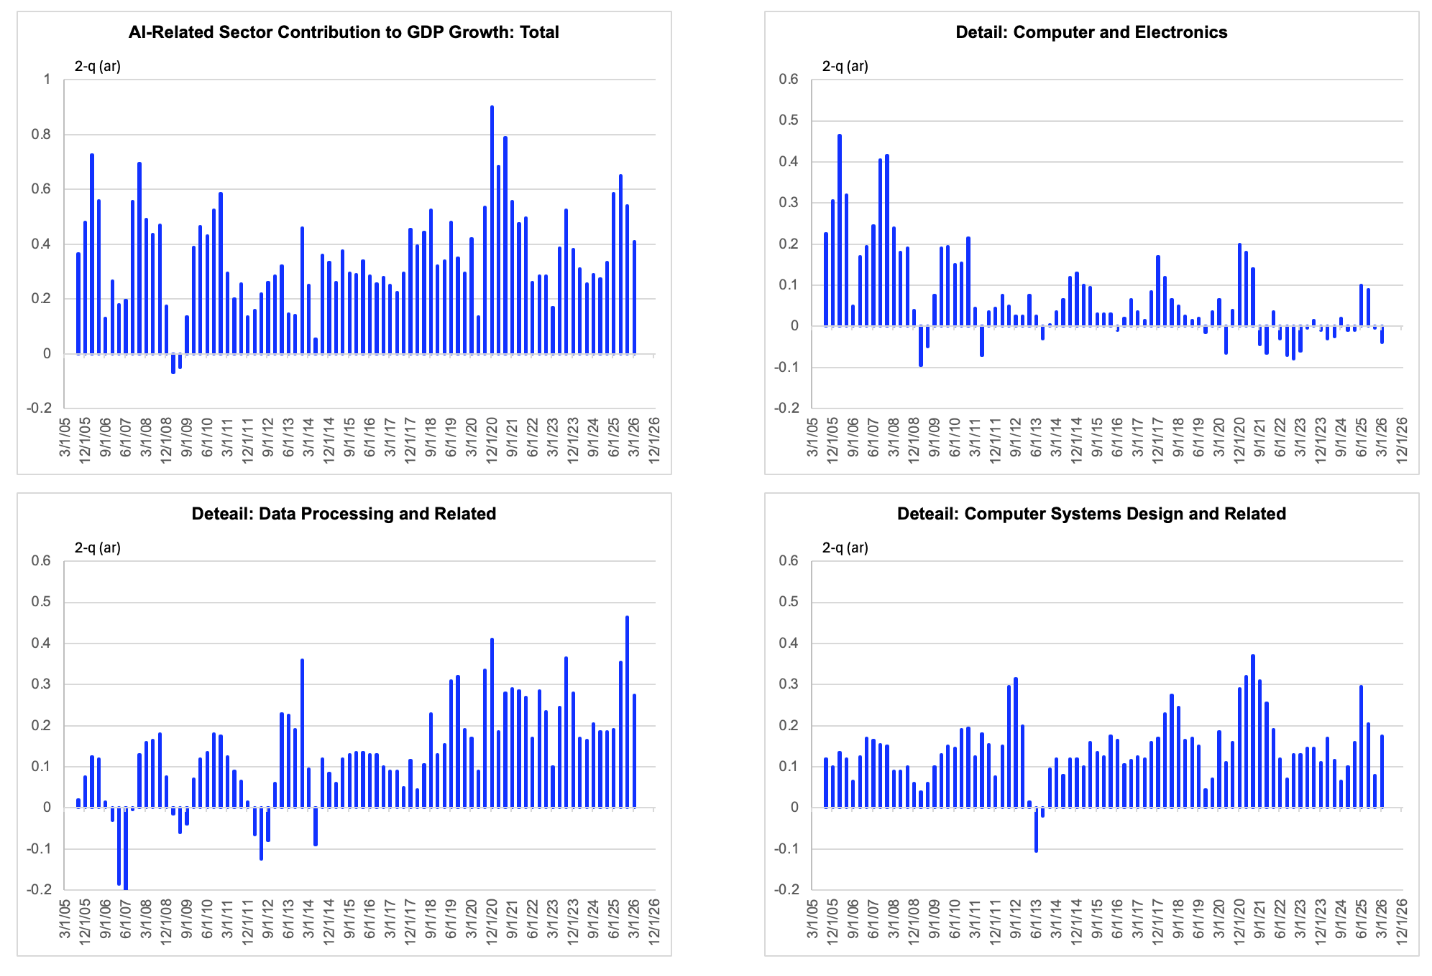
The chart below, shows the contribution to real value added growth (which at the level of the overall economy is equal to real GDP). Note that the contribution from hardware has recently been negative, which goes to the observation above about the nominal gain there being largely price. And more fundamentally, there has been little impetus from this source in recent years because the hardware involved here is largely importable. Again-double edged sword. The impetus from AI, viewed through this lens, is largely in computers systems and design (i.e. the thinking side) and then data processing (e.g., what the data centers bring to the table after we account for the fact that the chips are not yet largely American).
America is the hostest with the mostest
Data are actual to 2026 Q1.
Note also that the add from the data processing side has recently begun to cool. There is no drag here, but the impetus is lower than it was. And what it was was the majority of the overall impetus from AI. My main interest here is to report what has recently been going on and to emphasize some simple points of quantification, which – if I may – are occasionally missed by people with greater field expertise here. But I would just point out that if you think the demand for compute might begin to stabilize, because of a shift to marginal cost pricing among the AI firms or because of a shift to more compute efficient AI (e.g., as available from China) then this is where you would see that effect. Beyond that, I am all ears.
But the idea I would like to put on the table here is that the case for a continued rates-hawkish impetus from this sector is now less clear. I would continue to stick with the view that a major negative shock from this sector is unlikely. One reason for that is beyond the context of this data update: there is not yet much credit excess in this space. But the modera scale of the add to GDP, rather than domestic demand, fits into that same conclusion. Such is the view from the cheap macro seats. Like you, I will be following the insights of the field experts here going forward, as always.

