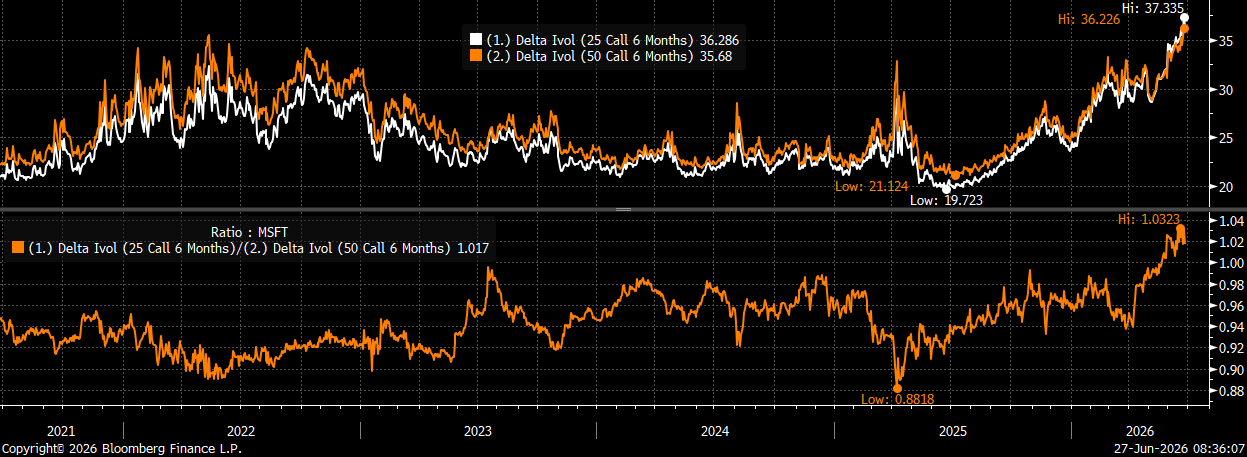
The action last week in the market, specifically in the technology names, was something we have now been seeing for the better part of three weeks. When the AI semiconductor/memory trade has been working, like it did after Micron (MU) posted stellar results on Wednesday night, we saw continued weakness in the hyperscalers and software names. Then on Friday, when those weaker groups were rallying, we saw a large pullback in the chip and memory stocks. This led to an overall decline in both the Nasdaq (QQQ) and entire market (SPY) to end the week. Until we are able to see both those parts of the tech trade working together, like they did for most of April and May, it is likely to keep the indices in check (or potentially produce further declines like we saw to end last week). In fact, on Friday we saw the SPY close below its 50-day moving average for the first time since early April (and that is after it was unable to make a new high after the move lower to start the month and subsequent attempted rally after).
SPY closed below its 50-day moving average for the first time since early April on Friday
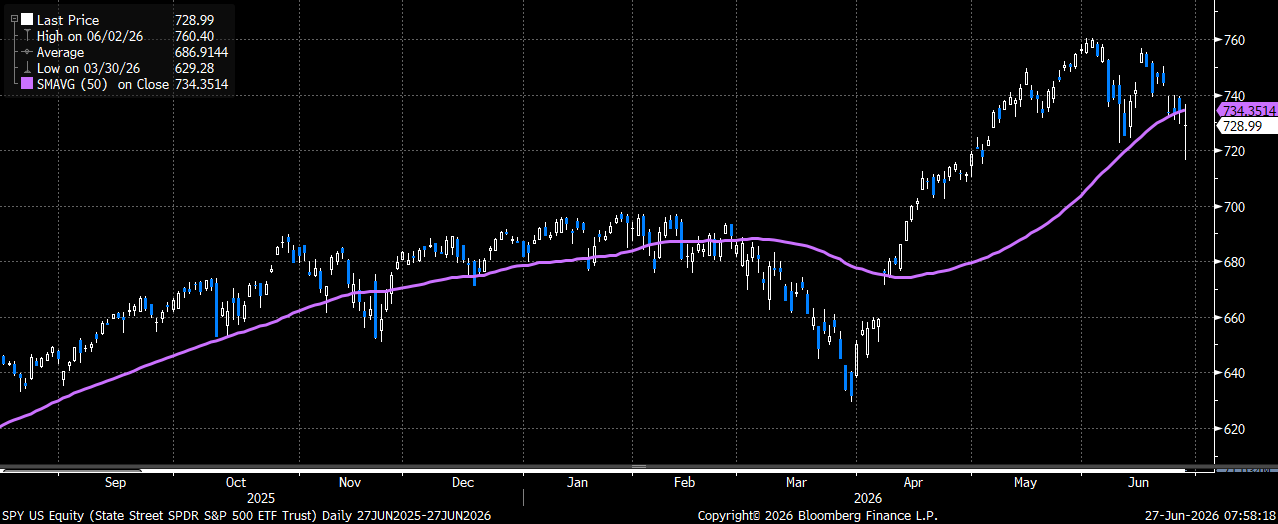
Speaking of the hyperscalers, it has been this group and most of the rest of the Mag7 that has clearly been weighing on the markets. Since peaking in mid-May, the Mag7 is down more than 13%, while both QQQ and SPY are only down ~ 2% over that time. I highlighted this a few weeks ago (here), and was why I believed we could see continued weakness/underperformance by QQQ given the large weighting these names have in the index. With that being said, many of these names are now down considerably from their highs and could be candidates to move back higher over the second half of the year.
The Mag7 have lagged both QQQ and SPY by a considerable amount since mid-May
When looking at many of these names, the two things that stand out to me are; 1) six-month implied volatility trades at/near the multiyear highs and 2) upside calls are “rich” to the closer to the money calls. Typically, when I see this type of volatility/skew setup, I want to own 1×2 call spread overlay trades to offset the elevated volatility, while capturing the very favorable call skew. Looking at two of the worst performing names in the Mag7 of late (MSFT & AMZN), this is no exception. Here are examples of costless overlay trades for each of those names I would strongly consider adding if currently long (specifically if buying/adding exposure down at these levels):
Microsoft (MSFT)
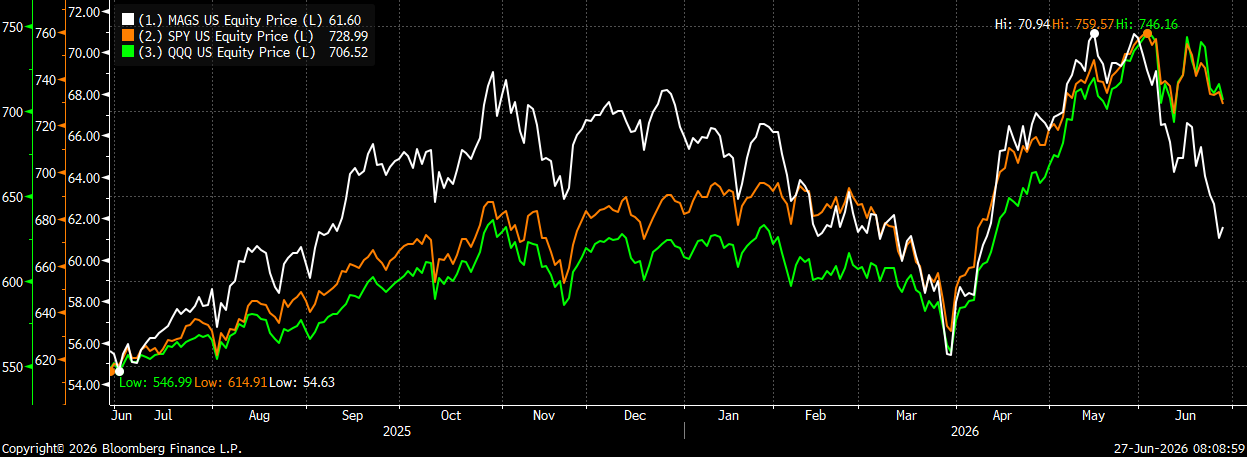
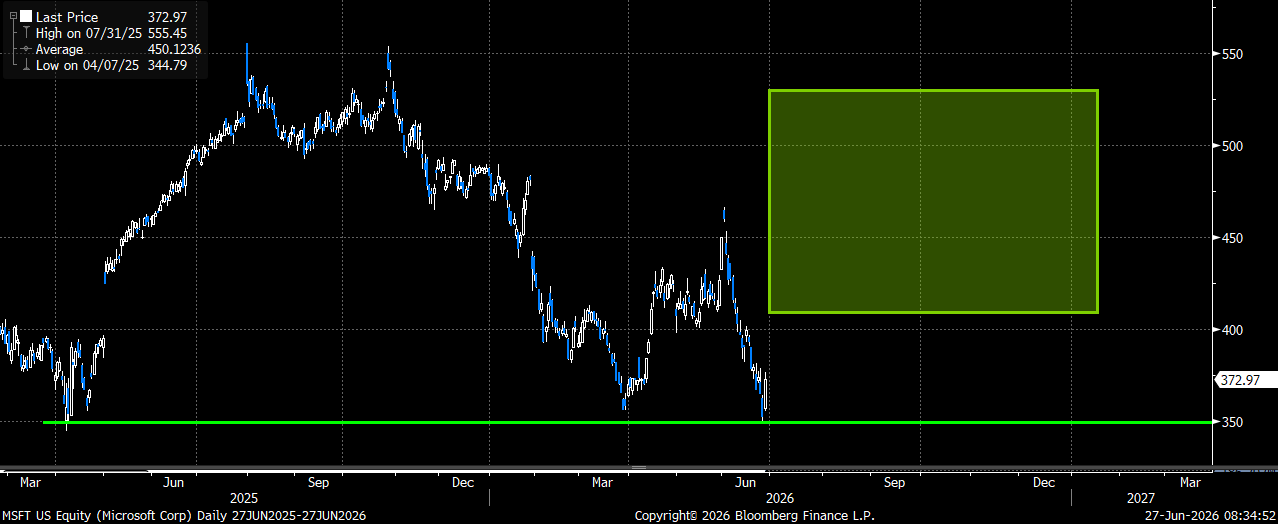
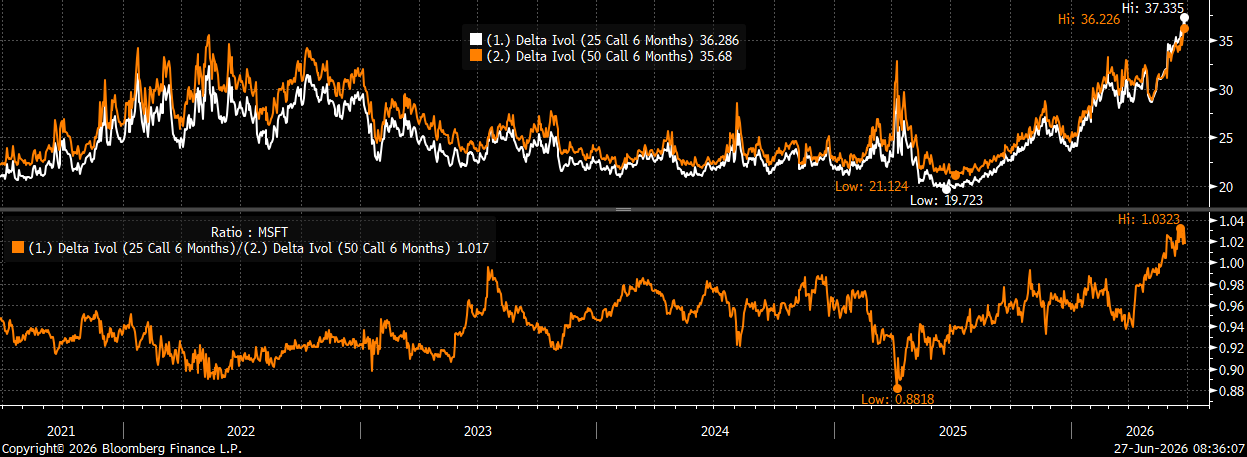
Before the impressive rally on Friday, which also occurred on massive volume, MSFT shares had declined by as much 37% from their highs hit in October. In fact, the sharp decline had brought the stock back to the April 2025 tariff lows. Perhaps even more significant was the move in implied volatility, with 6-month vol having moved up from 22 to 37 (to a fresh five year high). Not only has volatility gotten expensive, but in addition, the upside 25-delta calls are now trading at their richest skew to the at the money 50-delta calls. Again, when we have a situation like this of a large decline in underlying shares, overall volatility bid up AND upside calls trading “rich” to the at the money calls, we want to be looking at trades/strategies that offset the vol while capturing this attractive call skew.
Trade:
Buy MSFT Jan 15th 410 calls 1x
Sell MSFT Jan 15th 470 calls 2x
Trades for ~ EVEN (MSFT 373 Fri close ref)
The GREEN area highlights where this costless overlay option trade makes money/outperforms stock at expiration
Trade Details:
- Buying the costless 6-month (Jan) 1×2 call spread as an overlay trade to an existing long MSFT equity position
- Trade will make money/outperform between 410 and 530 at Jan 15th expiration (+10% to +42%) with NO added downside risk
- Trade has a small short delta, and has positive carry (theta) to start
- The WORST case is the stock rallies too much and you effectively sell some shares at 530 equivalent by January (42% higher and ~ 80% annualized)
- Implied vol and call skew is very likely to “normalize” should we start to see shares stabilize and move back higher (another reason I really like this trade)
- Please reach out to me or the 22V sales team for updated pricing and execution capabilities
MSFT 6-month (Jan) implied volatility is up from 22 to 37 and trades at a five-year high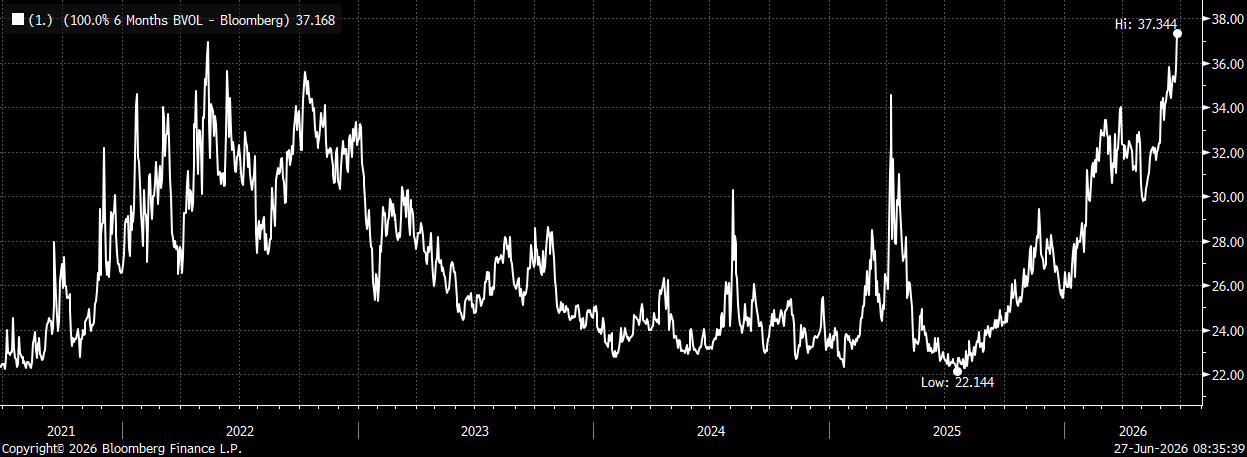
MSFT 6-month upside call skew also trades at a 5-year high (bottom chart)
Amazon (AMZN)
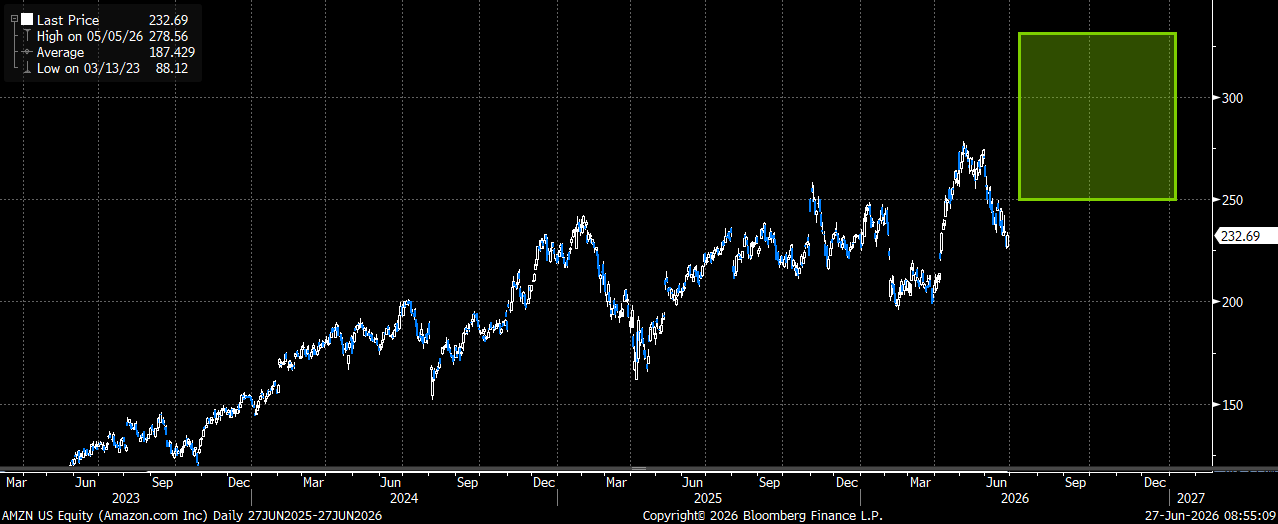
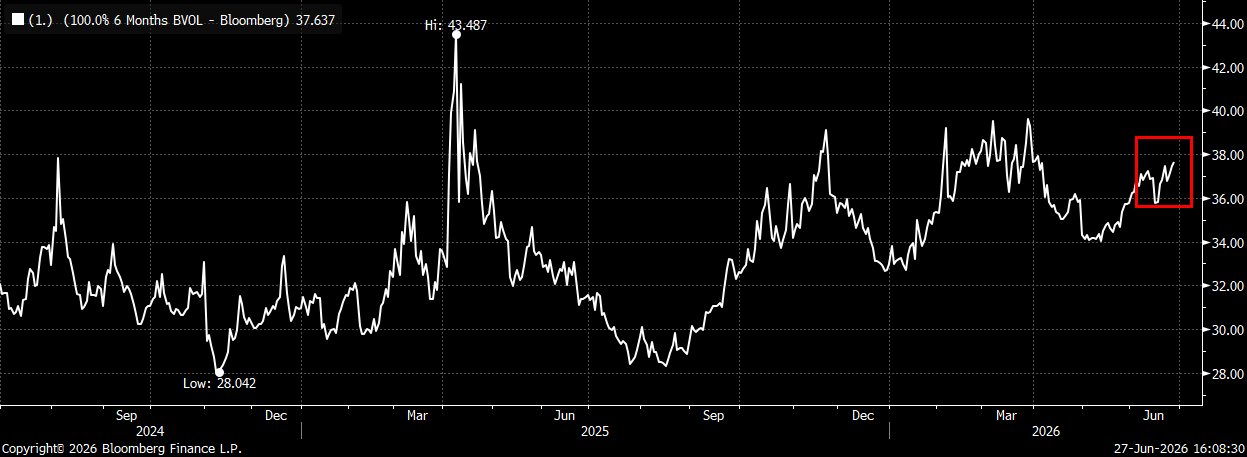
Before the rally on Friday, AMZN shares had declined by nearly 20% from their recent (all-time) highs, while underperforming the indices by a very wide margin. Much like with MSFT, the 6-month implied vol in AMZN has been steadily climbing and is now just below the recent highs. In addition, I am also seeing 6-month upside call skew also trading at the 2-year highs. Once again, I think this is a fantastic opportunity to establish costless 1×2 overlay trades in the name to position for a potential move back higher over the second half of the year.
Trade:
Buy AMZN Jan 15th 250 calls 1x
Sell AMZN Jan 15th 290 calls 2x
Trades for ~ EVEN (AMZN 232.69 Fri close ref)
The GREEN area highlights where this costless overlay option trade makes money/outperforms stock at expiration
Trade Details:
- Buying the costless 6-month (Jan) 1×2 call spread as an overlay trade to an existing long AMZN equity position
- Trade will make money/outperform between 250 and 330 at Jan 15th expiration (+7.4% to +42%) with NO added downside risk
- Trade has a small short delta, and has positive carry (theta) to start
- The WORST case is the stock rallies too much and you effectively sell some shares at 330 equivalent by January (42% higher and ~ 80% annualized)
- Overselling the Jan 290 calls, which is a level ABOVE the all-time highs reached in May
- Implied vol and call skew is very likely to “normalize” should we start to see shares stabilize and move back higher (another reason I really like this trade)
- Please reach out to me or the 22V sales team for updated pricing and execution capabilities
AMZN 6-month (Jan) implied volatility trading just below the 2-year highs
AMZN 6-month upside call skew also trades at a 2-year high (bottom chart)