Back Portfolio Strategy

Consumption Data Indicate Households Feel Financially Secure

Published on June 26, 2026

Download the PDF Report

By

Dennis DeBusschere

Kevin Brocks

Sophia Wang

DAILY STRATEGY: Main Point – We remain long Retail stocks. Retail stocks remain cheap on a relative basis (NTM PE spread at the 25th%tile relative to the S&P 1500) and have increasing EPS growth expectations relative to the S&P 1500. Since late May, we have had high conviction in long retail, and other Non AI related Cyclicals (HERE). We first introduced the asymmetry in the non-AI related Cyclicals in early May. Lower oil and 10yr yields being the positive catalyst. Today we mark to market the consumer data and trends following Personal Consumption Expenditures and Income data. The high frequency indicators of consumer spending are updated as well. We also take a victory lap on how expected AI related productivity growth is encouraging spending now! It’s not leading to weak spending based on fears over a job apocalypse.

First the Facts – The Consumption data yesterday showed REAL personal spending growth around 2%. Nominal spending growth is close to 5% though and the Income data suggests Nominal Income growth is running in the 4-4.5% range. Recent reports from PNC and BAC in both point to lower-income consumers starting to spend more again.

Two Things to Consider – 1) as the energy shock fades there is upside risk to REAL spending and Income growth, and 2) it should be appreciated how quickly households increased spending despite tariffs and higher gas prices. This suggests households feel financially secure and expect income to increase over time. Although there is some downside risk to consumer spending in the back half of 2026 as the tax refund impact fades, the consumer backdrop remains healthy.

How Expected Faster Productivity Growth Supports Consumption – We noted back in early February that the concerns around AI eliminating jobs and causing a confidence shock or recession through higher unemployment, over the next 1-3 years, was just wrong. Households feeling secure (see above) and increasing spending help reinforce WHY we thought investors were missing the positive economic demand story from AI that was RIGHT IN FRONT OF US. Investors seemed to be focused more on what COULD happen. Not what was happening.


To reinforce what typically happens (HERE) and what has played out. When productivity is expected to grow more quickly, it creates an expectation of faster future income growth. This encourages households to “draw some of that future income into current consumption,” which naturally lifts r ∗. FYI – the Fed has just made it clear that they think r* is higher. The Fed Funds rate is expected to remain above 3.,

Also, the massive capital spending boom required to implement AI-driven productivity gains significantly raises the overall demand for investment funds, further pushing up the equilibrium interest rate. Capex remains a support for economic growth and the income created from that capex will typically recycle through the economy.

Bottom line – The household and corporate sector response to an expected productivity boom is playing out. The basic “inside the box” macro thinking has served us well. The obvious risks to consumer spending are higher inflation leading to an aggressive fed hike cycle, or a significant disappointment in AI productivity. I.e. household and corporate spending slows (savings rates increase in the private sector) because it turns out AI tools are great to play with, but or not creating as much value as perceived.

Charts below…

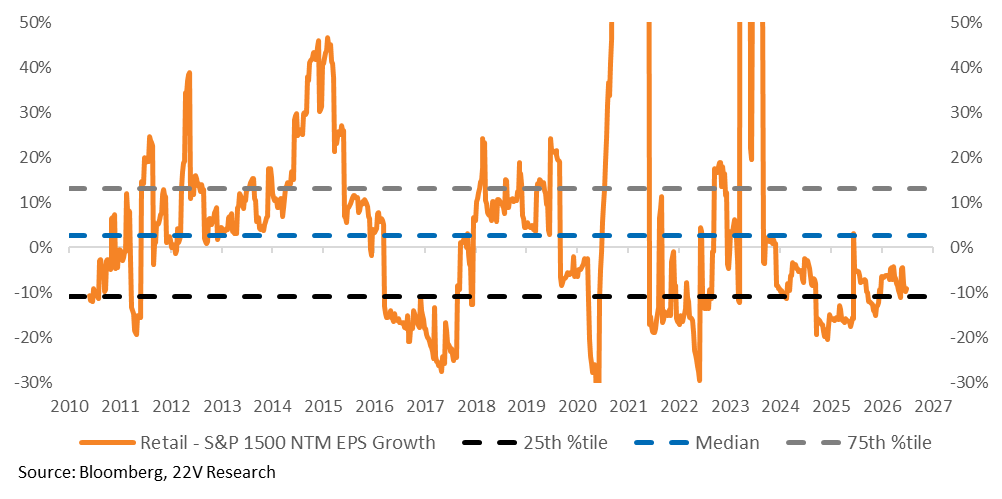
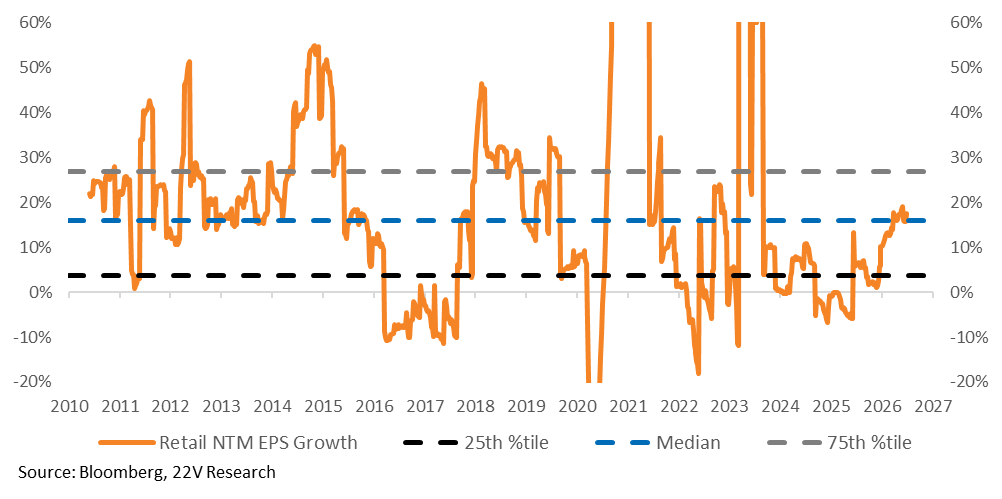
The Retail names remain relatively cheap and have been increasing NTM EPS growth relative to the S&P 1500.
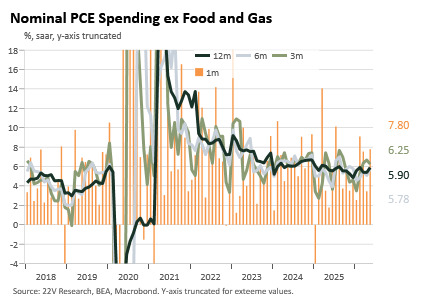
Nominal consumer spending is strong.
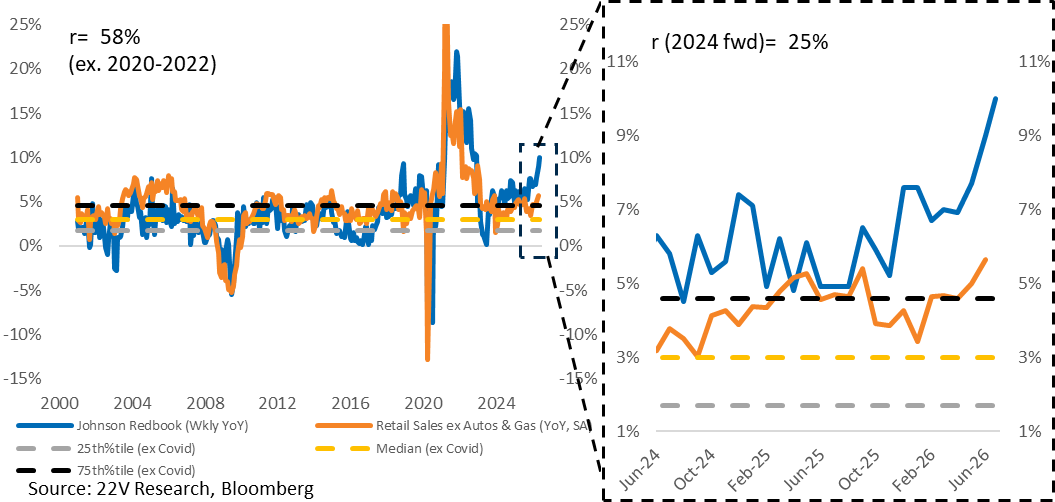
High Frequency Johnson Redbook Index Same Store Sales Weekly YoY increased to 10% from the previous week’s 9.4%. Johnson Redbook is a weekly, sales weighted measure of YoY same store sales growth at large U.S. general merchandise retailers (brick-and-mortar). It tracks sales at stores open at least a year, comparing the current week with the same week a year ago to strip out the effect of store openings and closures.
A graph of a graph of a graph of a graph of a graph of a graph of a graph of a graph of a graph of a graph of a graph of a graph of a graph of

AI-generated content may be incorrect.

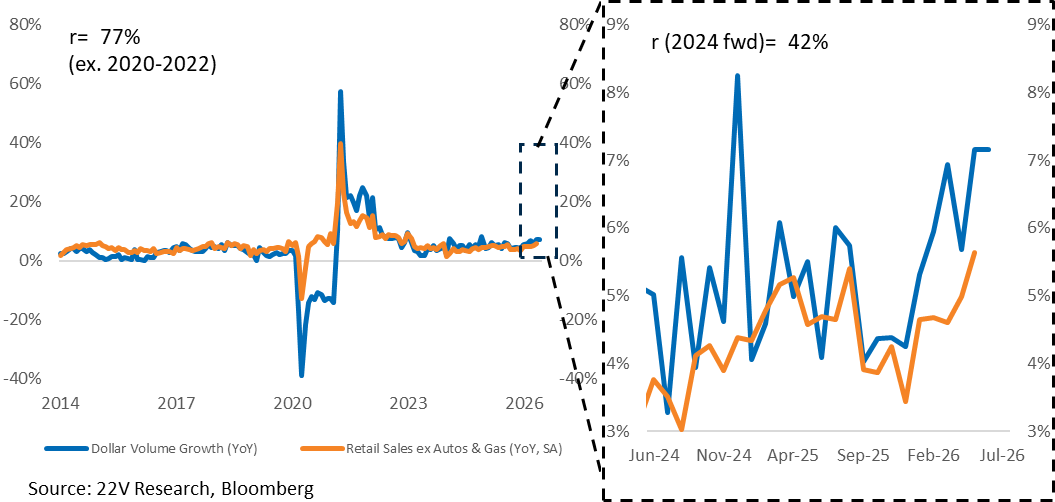
Dollar volume growth has improved and now sits at 7.16%. Fiserv’s Dollar Volume Growth tracks the YoY percentage change in same‑store sales dollar volume based on transactions processed through Fiserv’s merchant networks, providing a high‑frequency proxy for U.S. consumer card spending.
A graph of a graph of a graph of a graph of a graph of a graph of a graph of a graph of a graph of a graph of a graph of a graph of a graph of

AI-generated content may be incorrect.

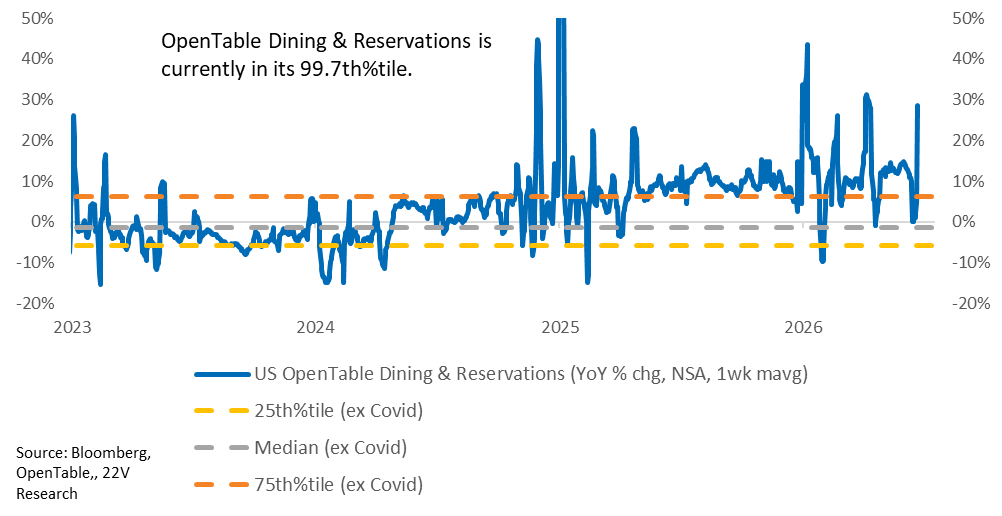
OpenTable dining & reservations have increased to its 99.7th%tile. The series measures the YoY change in seated diners from online reservations (for restaurants active on OpenTable), comparing the same day of the same week this year to last year. It is a noisy metric influenced by holiday timing, events, and weather (i.e, Father’s Day shifting dates).
A graph of a line graph

AI-generated content may be incorrect.

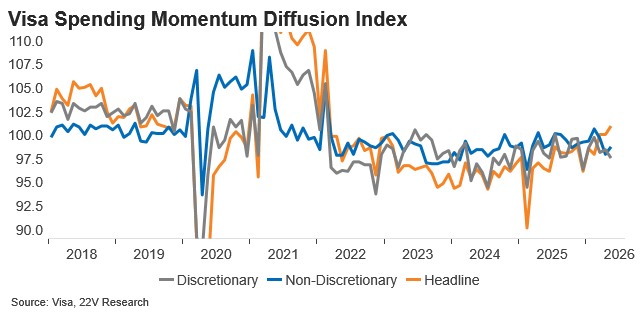
Visa’s spending momentum index has been improving over the past few months on a headline level. The Index classifies individual Visa cards based on whether their spending is rising or falling YoY, then aggregates those scores into an index centered around 100. In practice, it measures the breadth of year‑over‑year spending acceleration across consumers (how many are speeding up vs. slowing down), not the dollar level of total sales.
A graph of a number of different colored lines

AI-generated content may be incorrect.

DISCLOSURES AND DISCLAIMERS

Analyst Certification

The analyst, 22V Research Group, primarily responsible for the preparation of this research report attests to the following: (1) that the views and opinions rendered in this research report reflect his or her personal views about the subject companies or issuers; and (2) that no part of the research analyst’s compensation was, is, or will be directly related to the specific recommendations or views in this research report.

Analyst Certifications and Independence of Research.

Each of the 22V Research analysts whose names appear on the front page of this report hereby certify that all the views expressed in this Report accurately reflect our personal views about any and all of the subject securities or issuers and that no part of our compensation was, is, or will be, directly or indirectly, related to the specific recommendations or views of in this Report.

22V Research (the “Company”) is an independent research provider. The Company is not a member of the FINRA or the SIPC and is not a registered broker dealer or investment adviser. 22V Research has no other regulated or unregulated business activities which conflict with its provision of independent research.

22V Research, LLC is a professional services and independent publication organization. 22V Research, LLC is not a securities broker-dealer, not a member of the Financial Industry Regulatory Authority (FINRA), not a registered investment advisor (RIA) and not a member of SIPC.

Securities transactions, when offered, are offered by 22V Securities, LLC through LPS Capital, LLC. Certain employees of 22V Securities, LLC are dually registered as securities representatives of LPS Capital, LLC or Analyst Hub Securities, LLC. 22V Securities, LPS Capital and Analyst Hub Securities are members FINRA, SIPC.

https://brokercheck.finra.org/

Current Ratings Definition.

SECTOR OUTPERFORM: An “outperform” rating anticipates the company will outperform the S&P Regional Banking Index (peer group).

SECTOR PERFORM: A “market perform” rating anticipates the company will perform in line with the S&P Regional Banking Index (peer group).

SECTOR UNDERPERFORM: An “underperform” rating anticipates the company will underperform the S&P Regional Banking Index (peer group).

Limitation Of Research And Information.

This Report has been prepared for distribution to only qualified institutional or professional clients of 22V Research Group. The contents of this Report represent the views, opinions, and analyses of its authors. The information contained herein does not constitute financial, legal, tax or any other advice. All third-party data presented herein were obtained from publicly available sources which are believed to be reliable; however, the Company makes no warranty, express or implied, concerning the accuracy or completeness of such information. In no event shall the Company be responsible or liable for the correctness of, or update to, any such material or for any damage or lost opportunities resulting from use of this data. Nothing contained in this Report or any distribution by the Company should be construed as any offer to sell, or any solicitation of an offer to buy, any security or investment. Any research or other material received should not be construed as individualized investment advice. Investment decisions should be made as part of an overall portfolio strategy and you should consult with a professional financial advisor, legal and tax advisor prior to making any investment decision. 22V Research Group shall not be liable for any direct or indirect, incidental or consequential loss or damage (including loss of profits, revenue or goodwill) arising from any investment decisions based on information or research obtained from 22V Research Group.

Reproduction And Distribution Strictly Prohibited.

No user of this Report may reproduce, modify, copy, distribute, sell, resell, transmit, transfer, license, assign or publish the Report itself or any information contained therein. Notwithstanding the foregoing, clients with access to working models are permitted to alter or modify the information contained therein, provided that it is solely for such client’s own use. This Report is not intended to be available or distributed for any purpose that would be deemed unlawful or otherwise prohibited by any local, state, national or international laws or regulations or would otherwise subject the Company to registration or regulation of any kind within such jurisdiction.

Copyrights, Trademarks, Intellectual Property.

22V Research Group, and any logos or marks included in this Report are proprietary materials. The use of such terms and logos and marks without the express written consent of 22V Research Group is strictly prohibited. The copyright in the pages or in the screens of the Report, and in the information and material therein, is proprietary material owned by 22V Research Group unless otherwise indicated. The unauthorized use of any material on this Report may violate numerous statutes, regulations and laws, including, but not limited to, copyright, trademark, trade secret or patent laws.
