Good evening, Chart Watchers –
Thelma Houston, no relation to Whitney Houston, had a monster disco hit in 1977 with the song, “Don’t Leave Me this Way.” The song was number 1 on the US Billboard Hot 100 in April 1977 and Houston ended up winning the Grammy Award for Best Female R&B Vocal Performance. She had big shoes to fill, however, because the song was first recorded by Harold Melvin & the Blue Notes and it appeared on their 1975 album, “Wake Up Everybody.” Music fans of a certain age will tell you that the song “Wake Up Everybody” is an all-time classic (!) and they’ll also tell you that the late great Teddy Pendergrass was the lead singer for Harold Melvin & the Blue Notes.
I can’t help but think of the song – either version, actually – when I look at the long-term chart for Microsoft because it wouldn’t shock me if investors are channeling their inner Thelma Houston / Teddy Pendergrass (“I can’t survive, I can’t stay alive; Without your love; Baby, don’t leave me this way.”) when they consider the following:
1 – MSFT has a Technical Score = 0; the worst Score on the 0 – 4 scale for my Technical Scoring System
2 – It has been below a deteriorating and now clearly downward-sloping 200-Day Moving Average since February 2026. MSFT also got the Dikembe Mutombo-treatment at the downward-sloping 200-Day Moving Average in early June and it’s down more than 18% since. MSFT is also below its 50-Day Moving Average.
3 – Daily momentum is negative, weekly momentum has been negative since early January 2026, and monthly momentum continues to decelerate at a rapid clip but it not yet in negative territory.
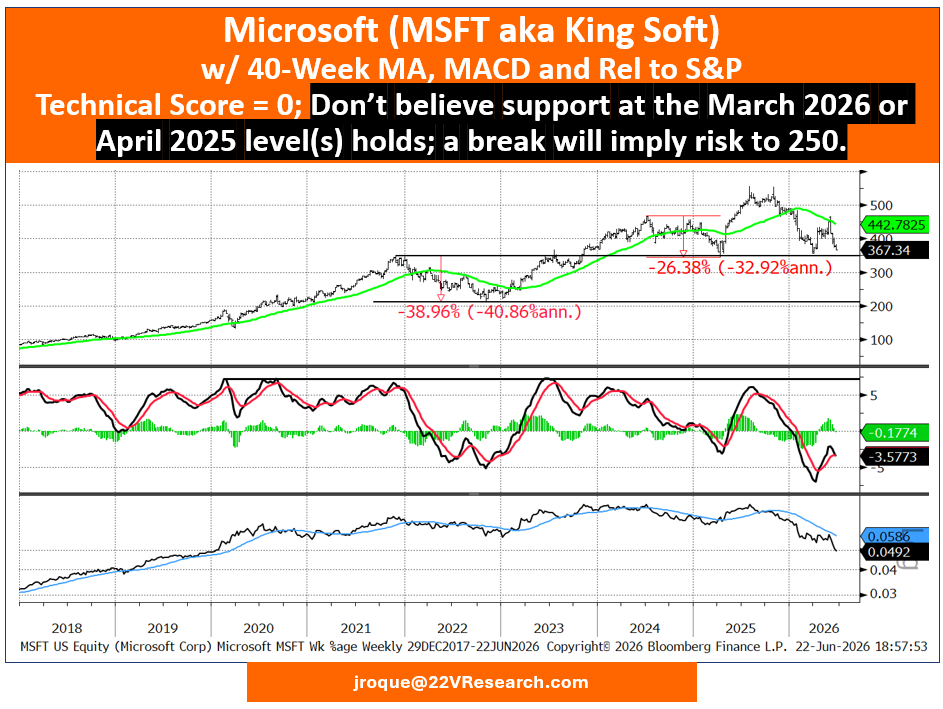
4 – MSFT is close to testing its March 2026 lows / support level – I do not believe this holds – which is the same price level first seen in November 2023. In sum, MSFT has not made any money in more than 2 1/2-years.
5 – MSFT is at a 6 1/2-year relative low vs. the S&P 500.
6 – While MSFT’s historical exploits are the stuff of legend — i.e.; from year-end 2012 – year-end 2025 it only had one down year in 2022 when it dropped -29% and six years (2013, 2017, 2019, 2020, 2021, and 2023) where it was up at least 38% with an average gain of 47%! — the stock has now suffered three bear market declines since late 2021 (-39% from Nov 2021 – Nov 2022; -26% from early July 2024 – mid-April 2025; -34% from Aug ’25 – late June 2026) which suggests to me that MSFT is undergoing an important trend change.
The following weekly chart shows MSFT with its 40-Week MA (top), its corresponding Weekly %-age MACD (middle), and Relative to the S&P with a 26-Week MA (bottom). Support for MSFT exists at the 355 level (see March 2026) and 345 – 350 (see April 2025) but, as noted in 4 above, I don’t believe support holds. A break of 350 – again, I believe this will happen – will imply risk to 250. (early June failure at 450 – support at 350 = 100; 350 – 100 = 250)