Back Portfolio Strategy

Searching for S&P 500 Fair Value Monthly Update

Published on June 17, 2026

∙ Download the PDF Report

By

Dennis DeBusschere

Kevin Brocks

Sophia Wang

Now that 1Q earnings are wrapped up, we run through our monthly update of Fair Value to provide anchors to different scenarios, considering different scenarios for earnings, cash return, and valuation. This type of analysis has helped us discern interesting long market risk vs returns after drawdowns (COVID / Oct 2022).

The divergence between the implied equity risk premium (implied ERP), our preferred cash return valuation metric based on the work of Aswath Damodaran (HERE), and the NTM Earnings Yield – 10yr (the naïve ERP) is something we have addressed before, but return to today. The cash-return ERP is not at an extreme level, unlike the naïve ERP, which has dropped back down to its all-time low (consistent with higher NTM PEs).
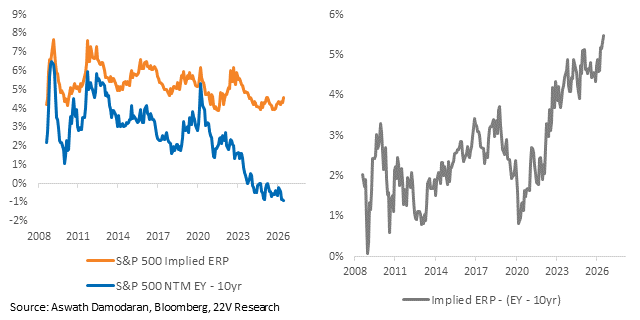
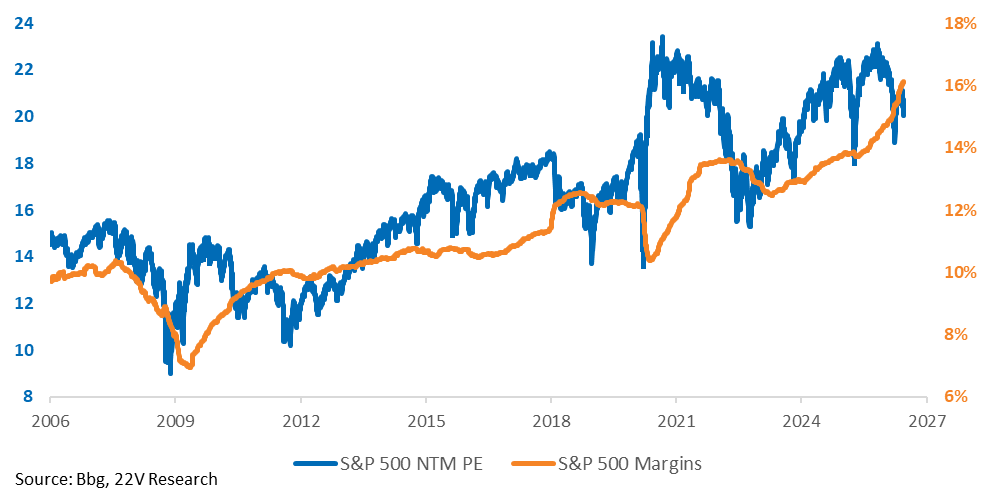
Broadly speaking, the cash-return-based methodology captures the effects of better margins and a higher ratio of earnings EXPECTED to be returned to investors. That is a critical part of the value proposition of holding the S&P 500 that the naïve equity risk premium misses over time. The naive equity risk premium just captures the current earnings yield and compares it to a 10yr duration asset (10yr Treasury). Logically that does not make sense (See Aswath Damodaran’s more detailed reasons why HERE).
A graph showing the growth of stocks

AI-generated content may be incorrect.

Specifically, this year, the implied ERP is diverging from the naïve ERP because of large positive revisions to earnings expectations beyond the next twelve months. That earnings increase coincides with a reduction in current cash returns. Investors are discounting that AI capex will have a positive ROI. Obviously, if that is not the case, the equity market is overvalued. That is the main question to ask and get right.

Details – The S&P 500 at an all-time high doesn’t screen as expensive when discounting cash return (dividends + buybacks / net income) beyond 1-year forward.

The implied ERP doesn’t make the risk-reward at an index level compelling here either. 1) Its level is near its long-term median. A mean reversion argument on valuation doesn’t make sense unless you think the economic regime will change dramatically. 2) There are elevated risks to the cash return profile now because of, guess what, AI ROI assumptions.

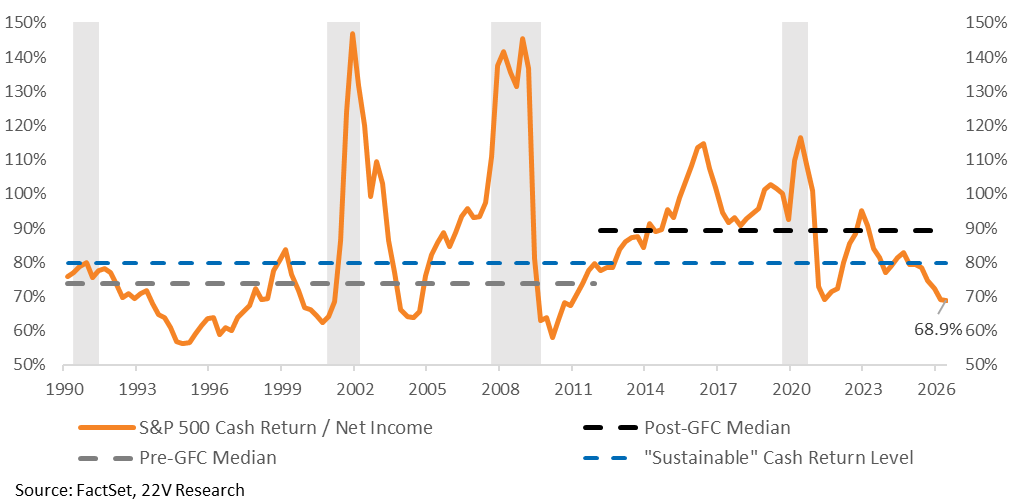
To be clear, we think AI will be effective as a margin-boosting and/or revenue-boosting tool. The early indications are positive (HERE). There is considerable upside to fair value estimates if/as companies utilize AI (that’d be the trigger for a different economic regime). The problem is that AI disrupts the CERTAINTY of cash returns for incumbent tech and introduces forward volatility in earnings. That is not just a theory; cash return is currently impaired. In 1Q, the cash return ratio of the S&P 500 declined to its lowest level since the post-GFC and post-COVID recoveries as incumbent tech pivoted towards Capex and R&D.

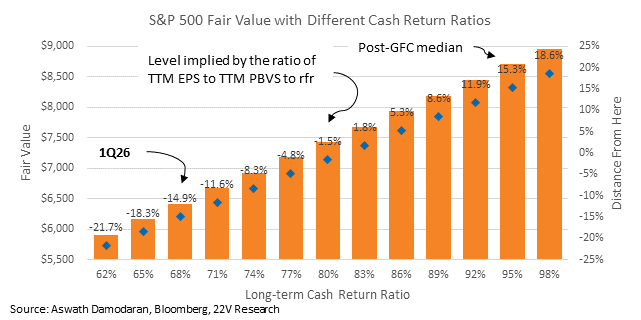
Investors are concerned that incumbent tech will end up in a protracted spending battle over AI and cash return will remain impaired. Or maybe AI just doesn’t create as much value as assumed. That is possible. Bottom line, if cash return was to hold at its level in 1Q, for 5+ years, S&P 500 fair value would be -15% lower. Investors are discounting higher earnings growth that translates, eventually, into higher cash returns. The question is more about WHO dominates the cash returns. A few winners (if switching costs are high) or all companies (if AI switching costs are low).

FYI, in our base case, we use the level of cash return implied by ROE – the index retains the earnings it needs to grow eps at the risk-free rate, returning the rest as cash. A bar chart of S&P 500 fair value with different cash return ratios is below.
A graph of a graph showing the value of a company

AI-generated content may be incorrect.

Going forward, it’ll be important to track the cash return contribution of the AI buildout beneficiaries. For example, NVDA announced an $80B buyback and raised its dividend from $0.01 to $0.25. There may be upside relative to investor concerns if the buildout companies begin to return cash. Fair value estimates are sensitive to cash return, so how much of the buildout money that ultimately flows to investors will be important. That is not something that can be assessed now though.

We walk through the regular updates that feed into our model below…

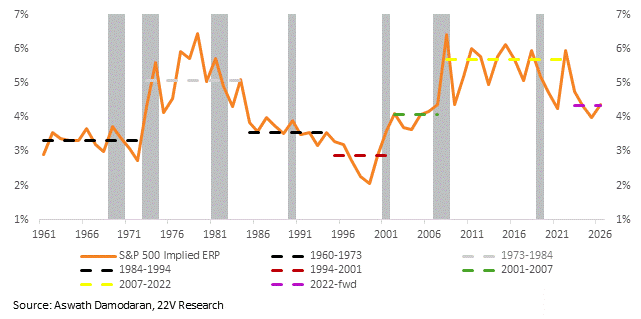
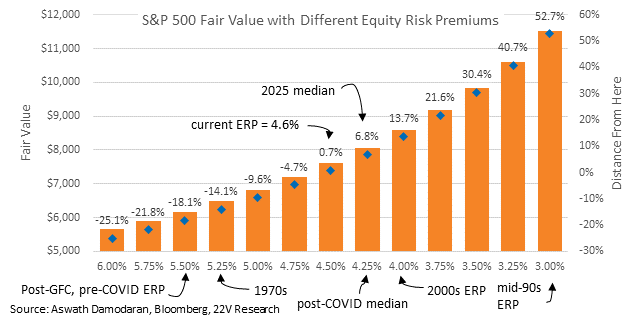
VALUATIONS: The implied equity risk premium (ERP), our preferred cash return valuation metric based on the work of Aswath Damodaran (HERE), has moved up from ~4.35% at the beginning of the year to ~4.6%. FYI, the ERP at its high (PEs at their low) this year was consistent with the 1970s stagflation and the post-GFC lack of demand/liquidity trap. Macro data, in aggregate, kept indicating an ongoing NORMAL economic expansion (HERE). Not a liquidity trap or 70’s style stagflation. It has now fallen back to closer in-line to its long-term median.

First charts are the longer term chart of the implied ERP and Fair Value under different ERPs below. If the ERP goes back to its 2025 median (and we hold 10yr, EPS expectations etc., all equal), fair value is +7% higher. The risk reward is interesting, but not super compelling.
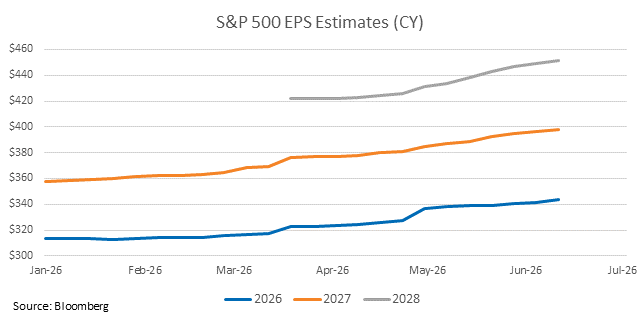
EARNINGS: Earnings estimates have increased, significantly, this year, helped by an extremely strong 1Q (HERE). Realizing the cash return in 1Q and rolling forward one quarter adds +140 points to fair value.
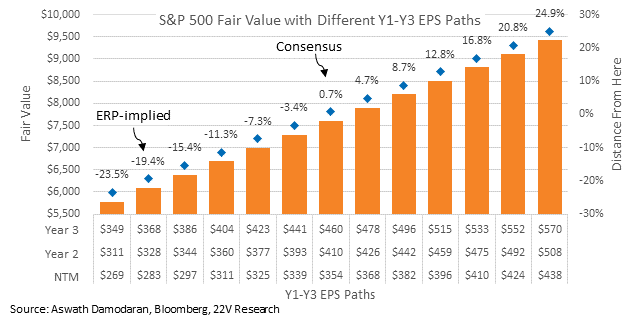
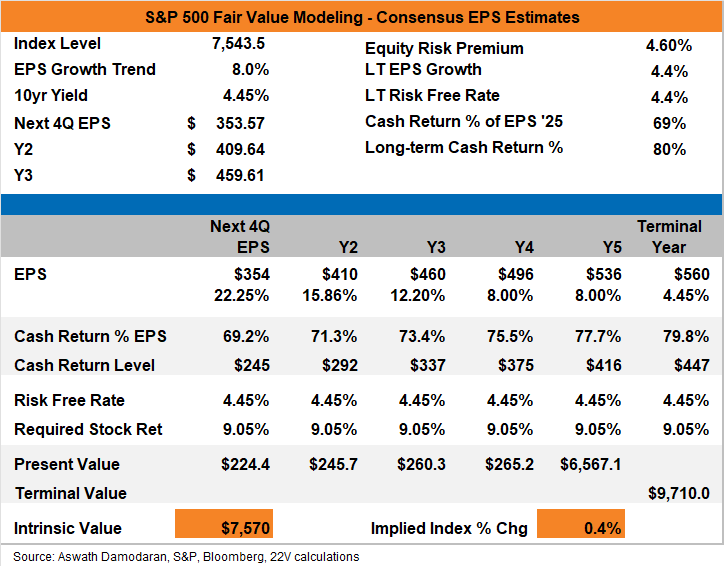
The table demonstrates our fair value calculation below. Our methodology is based on the work of Aswath Damodaran, a valuation guru at NYU. Great resource HERE. We are also happy to send the model.
A screenshot of a graph

AI-generated content may be incorrect.

DISCLOSURES AND DISCLAIMERS

Analyst Certification

The analyst, 22V Research Group, primarily responsible for the preparation of this research report attests to the following: (1) that the views and opinions rendered in this research report reflect his or her personal views about the subject companies or issuers; and (2) that no part of the research analyst’s compensation was, is, or will be directly related to the specific recommendations or views in this research report.

Analyst Certifications and Independence of Research.

Each of the 22V Research analysts whose names appear on the front page of this report hereby certify that all the views expressed in this Report accurately reflect our personal views about any and all of the subject securities or issuers and that no part of our compensation was, is, or will be, directly or indirectly, related to the specific recommendations or views of in this Report.

22V Research (the “Company”) is an independent research provider. The Company is not a member of the FINRA or the SIPC and is not a registered broker dealer or investment adviser. 22V Research has no other regulated or unregulated business activities which conflict with its provision of independent research.

22V Research, LLC is a professional services and independent publication organization. 22V Research, LLC is not a securities broker-dealer, not a member of the Financial Industry Regulatory Authority (FINRA), not a registered investment advisor (RIA) and not a member of SIPC.

Securities transactions, when offered, are offered by 22V Securities, LLC through LPS Capital, LLC. Certain employees of 22V Securities, LLC are dually registered as securities representatives of LPS Capital, LLC or Analyst Hub Securities, LLC. 22V Securities, LPS Capital and Analyst Hub Securities are members FINRA, SIPC.

https://brokercheck.finra.org/

Current Ratings Definition.

SECTOR OUTPERFORM: An “outperform” rating anticipates the company will outperform the S&P Regional Banking Index (peer group).

SECTOR PERFORM: A “market perform” rating anticipates the company will perform in line with the S&P Regional Banking Index (peer group).

SECTOR UNDERPERFORM: An “underperform” rating anticipates the company will underperform the S&P Regional Banking Index (peer group).

Limitation Of Research And Information.

This Report has been prepared for distribution to only qualified institutional or professional clients of 22V Research Group. The contents of this Report represent the views, opinions, and analyses of its authors. The information contained herein does not constitute financial, legal, tax or any other advice. All third-party data presented herein were obtained from publicly available sources which are believed to be reliable; however, the Company makes no warranty, express or implied, concerning the accuracy or completeness of such information. In no event shall the Company be responsible or liable for the correctness of, or update to, any such material or for any damage or lost opportunities resulting from use of this data. Nothing contained in this Report or any distribution by the Company should be construed as any offer to sell, or any solicitation of an offer to buy, any security or investment. Any research or other material received should not be construed as individualized investment advice. Investment decisions should be made as part of an overall portfolio strategy and you should consult with a professional financial advisor, legal and tax advisor prior to making any investment decision. 22V Research Group shall not be liable for any direct or indirect, incidental or consequential loss or damage (including loss of profits, revenue or goodwill) arising from any investment decisions based on information or research obtained from 22V Research Group.

Reproduction And Distribution Strictly Prohibited.

No user of this Report may reproduce, modify, copy, distribute, sell, resell, transmit, transfer, license, assign or publish the Report itself or any information contained therein. Notwithstanding the foregoing, clients with access to working models are permitted to alter or modify the information contained therein, provided that it is solely for such client’s own use. This Report is not intended to be available or distributed for any purpose that would be deemed unlawful or otherwise prohibited by any local, state, national or international laws or regulations or would otherwise subject the Company to registration or regulation of any kind within such jurisdiction.

Copyrights, Trademarks, Intellectual Property.

22V Research Group, and any logos or marks included in this Report are proprietary materials. The use of such terms and logos and marks without the express written consent of 22V Research Group is strictly prohibited. The copyright in the pages or in the screens of the Report, and in the information and material therein, is proprietary material owned by 22V Research Group unless otherwise indicated. The unauthorized use of any material on this Report may violate numerous statutes, regulations and laws, including, but not limited to, copyright, trademark, trade secret or patent laws.
