

The Federal Reserve’s quarterly Financial Accounts of the United States report was updated to March on Friday. The report confirms that the household and corporate sectors are maintaining quite healthy financial balances and are not becoming overextended, at least in aggregate, which is probably what matters most in the current context.
I am inclined to relate this favorable condition to the large fiscal deficit. That is allowing aggregate demand to be maintained at a pace consistent with full employment, without resort to the bubble dynamics that plagued the expansions of the 1990s and 2000s, for reasons I have been over in several earlier notes. The connection is not fully direct, but it is not difficult at all to see the deficit as causal, a point I emphasize because others don’t, perhaps because they are too focused on fiscal sustainability concerns. Such concerns are no longer wildly premature, as market-based measures of r* have recently pushed above g*. But the fiscal deficit’s short-run stabilizing influence, which will persist for as long as Treasuries are viewed as safe assets, seems still to be underappreciated.
Not quite so clear as before
Data are actual to 2026 Q1.
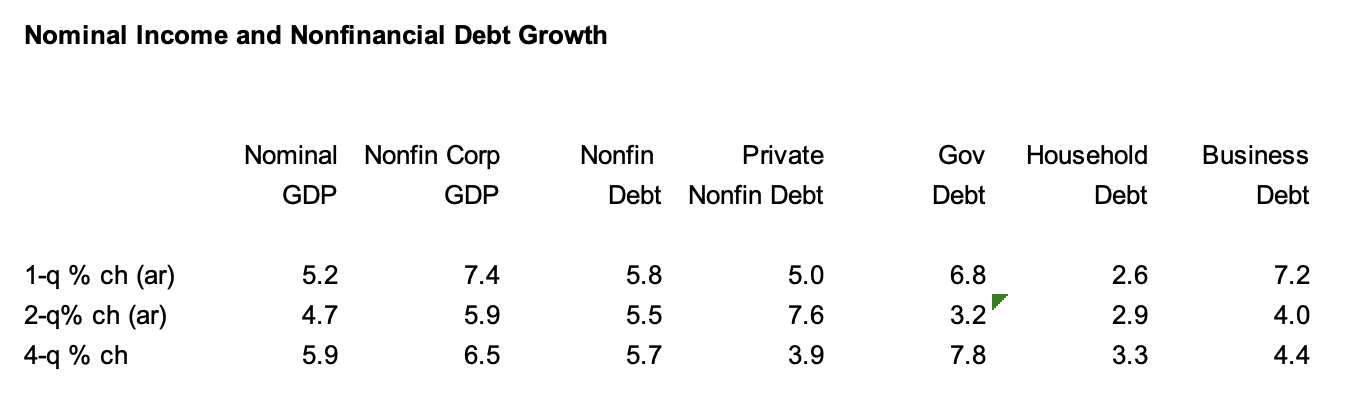
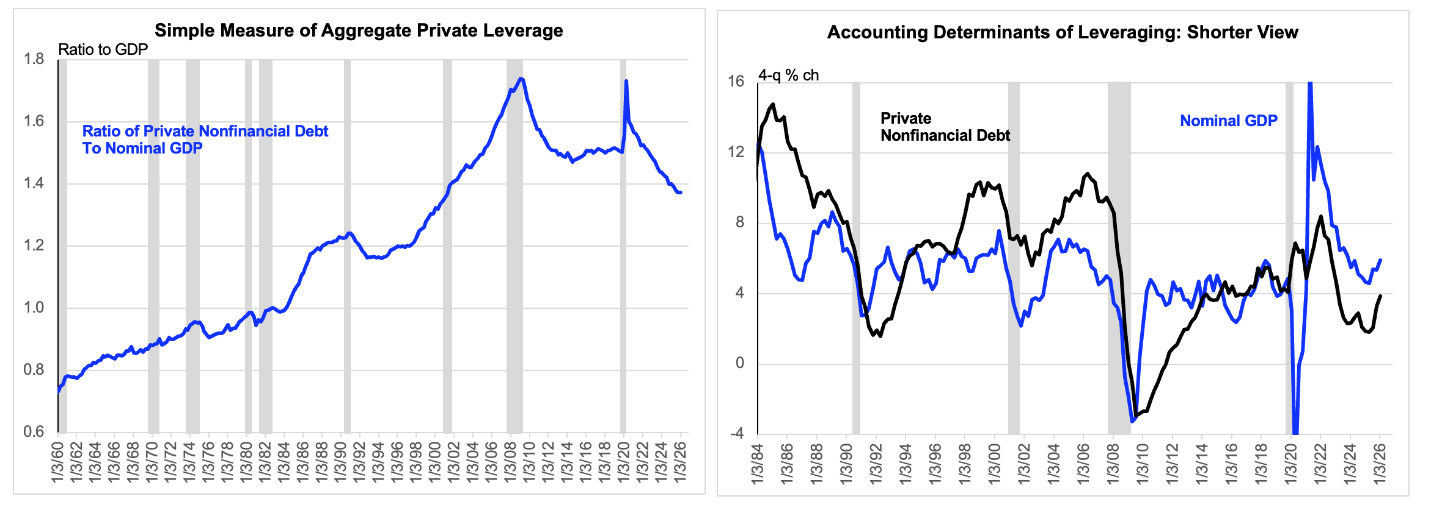
The table above and the picture below present what you may now recognize as the standard summary presentation of the Financial Accounts data. Nonfinancial debt growth has been quickening recently in typical late-cycle fashion. And this has begun to run near the pace of GDP growth, which has prevented further deleveraging – as measured mostly simply – in the overall private sector. (See the right panel of the chart below.) The household sector has continued to delever in aggregate – and quite unambiguously. But the situation in the business sector has recently become more complex, for reasons I will get into now.
The chart below confirms that the nonfinancial corporate sector continues to run a positive financial balance, that is, negative financing gap. As measured, this financial balance needs to be corrected for recurring sources of noise, which are set as annotations in the right and left panels of the chart. Beyond this, there was a huge swing in net capital transfers paid during the first quarter, which resulted in the financial surplus being inflated, as reflected in a plunging financing gap. I corrected that by subtracting the negative transfers from both gross saving and the financing gap.
This pause in deleveraging may be temporary
Data are actual to 2026 Q1.
To the main point here, even with this adjustment the nonfinancial corporate sector remains in surplus. This is hardly surprising, as measurement errors and minor accounting complexity aside, somebody has to fund the large fiscal deficit. And with the current account only moderately large, net capital inflows are not doing most of the work. It is either the corporate sector or the household sector – or, more apparently, both.
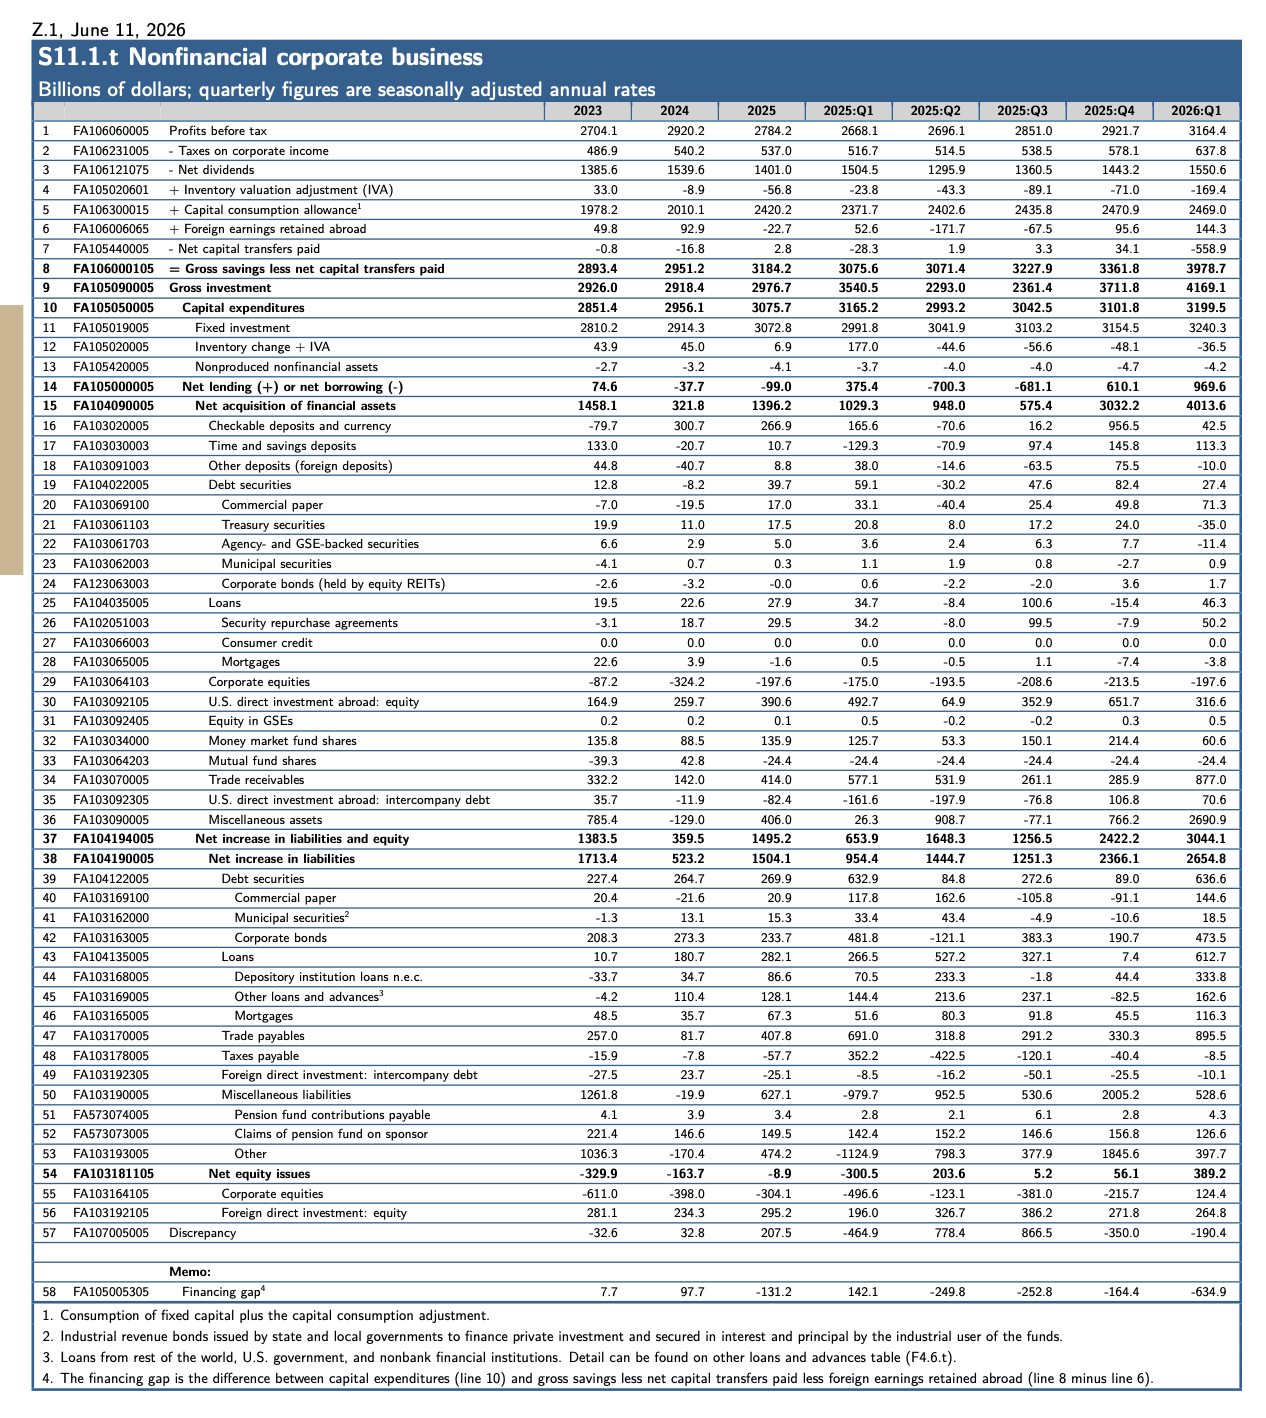
Nonfinancial corporate borrowing quickened during the first quarter despite the lift to savings from the capital transfers line item and the fact that the corporate sector is in financial surplus does not “need” the money. At least this is the case in aggregate, although I concede that distributional concerns have become more relevant recently and that we need to pay more attention to the financial position of the main participants in the AI buildout. That aside, returning to the aggregate data, the acceleration of debt growth was apparently related to – and I would guess driven by – the ongoing acceleration in the corporate sector’s acquisition of financial assets and related financial engineering.
Unfortunately, there was a massive spike in “miscellaneous” asset accumulation during the first quarter, which makes a story in its own right. This swing was five times the magnitude of the net capital transfers issue, for which I controlled in the discussion above, as you can see from line 36 in the table below. And its presence makes the flow data – away from the underlying financial balance – very difficult to interpret. For now, I would just say that this looks like financial engineering, which could well be related to AI. I expect to have more on that later. But predictably, the aggregate financial balance of the corporate sector remains in surplus.
Financial engineering in corporate sector created noise during Q1
Data are actual to 2026 Q1.
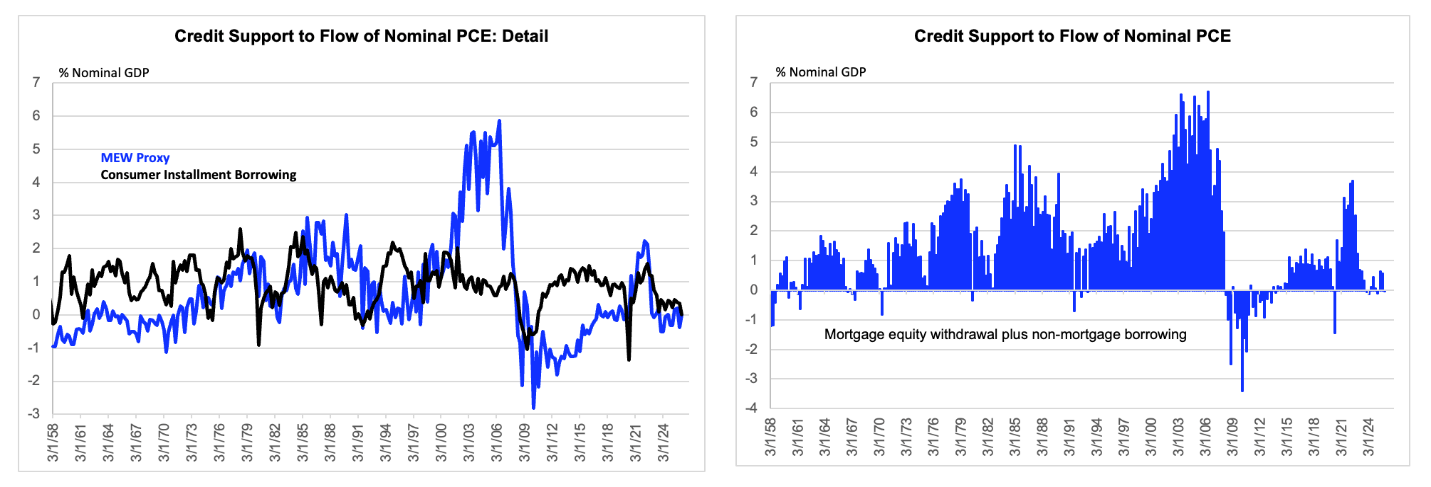
The story in the household sector remains far simpler. The household sector remains in large financial surplus, although that is not directly indicated in a chart here. This may sound odd, given the perennial concerns about the saving rate. But keep in mind that real asset accumulation in residential real estate is also depressed. Relatedly, growth is slow relative to income growth, which I proxy with GDP, although using PDI would show the same story qualitatively. And there is an aspect of this story that remains very underappreciated, with all the discussion of this or that credit aggregate having risen above a trillion dollars (pinky to lip). The flow of net credit extension to support consumer spending remains near zero. Contrast that with the 90s boom or even with the 2000s boom, where the main imbalance was in housing not consumption, at least not directly. The Federal Reserve never intended to inflate those imbalances, but by applying a conventional pursuit of its employment and price objectives at the medium term, in the presence of insufficiently accommodative fiscal policy, it ended up doing so. Those were very different times.
A minor caveat relates to distributional issues. Some folks are struggling at the low end. That matters normatively and might matter to us if it gets into credit availability. But for now, from a mercenary macro perspective, that does not affect the story much.
The household sector is a simple case at the macro level
Data are actual to 2026 Q1.

