

Weekly – Per the new format, we mark to market our main themes each week. Themes are bolded and market to market follows. The Knicks won. We are excited about that. Today we focus on the main macro themes and will come back on the idio later this week. Macro trends become more important assuming Strait of Hormuz supply shock risk is lowered.
Theme – The continued supply shock is a complicating factor. Marking To Market – We start with this theme today as there was good news last week. As we have noted, if the US economic growth is running at +3% with job growth much stronger than expected, the Strait of Hormuz (SOH) supply shock adds upside inflation tail risk. As long as the supply shock remains and US economic growth is resilient to that shock, risk assets will have a problem as 10yr yields and inflation expectations are biased higher.
Oil prices, 10yr yields and inflation expectations moved lower last week. The moves seems related to a potential MOU related to the Strait of Hormuz, but the decline in 1yr inflation swaps and oil prices started before the MOU news. Bottom line – Mr. Market is pricing in less supply shock inflation risk. The internal market regime was classified as an Everything Rally (risk-on factors performed best) as a result. That makes sense as the SOH has been the largest SHORT TERM swing factor for risk assets. Assuming SOH traffic normalizes over time, the focus moves to core inflation trends ex the supply shock and tariffs.
Theme – Lower Speed Limit Economy. GDP growth needs to be at or below 2%, assuming productivity trends hold at roughly 2%, to keep inflation in check. This theme is low conviction as it is based on macro variables that are hard to measure in real time (Productivity and Unit Labor Costs). Marking to Market –The ex-tariff pace of core inflation is running at least 2.5%. 2.5% core PCE should not trigger a Fed hike. CPI/PPI data did not change our outlook for hikes, which means financial conditions can remain at their historic easy levels. At least for now. If the labor market does not tighten, there is no reason for the Fed to hike or adopt a hawkish bias in the next 3-6 months. Wage trends from the most recent payroll report (hourly earnings growth down to 3.4% from 3.6%) reinforced our and many FOMC members view that tight labor markets are NOT the primary source of inflationary pressure.
That’s the good news. The bad news is it now looks likely that the Fed will mechanically raise its core PCE forecast for 2026 from 2.7% to at least 3.2%. 3.2% is probably a line in the sand. If the forecasts meaningfully above 3.2% (~3.5%) later this year, expect Fed hikes. Until then, the Fed will likely target at or just below 2% GDP growth, by holding the Fed funds steady until the “temporary” inflation impulse passes.
Maintaining the current level of fed funds and financial conditions for the rest of 2026 is fine for markets and supports fundamental factor gains (Growth, Momentum, Value, GARP) and Cyclicals relative to Defensives.
If economic growth DOES NOT SLOW in the back half of 2026, there is material risk of the Fed needs to tighten financial conditions (move to a hiking cycle) to slow demand growth and drive core inflation lower. GDP growth >3% would be too strong. Growth needs to slow. More below.
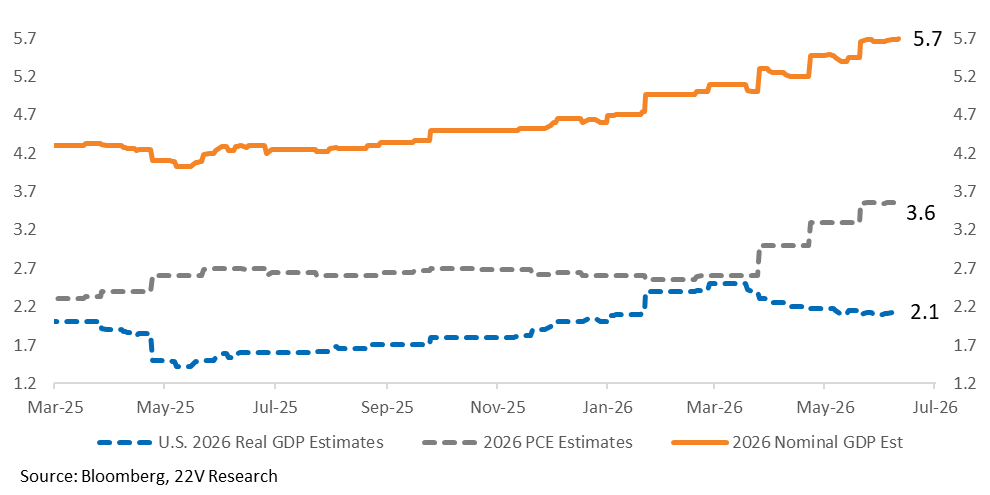
The 22V call is that the economy SHOULD slow some from its current unusually strong pace of underlying demand (+3%) as the fiscal impulse and post-tariff reacceleration tailwinds fade. Consumer, business activity ex-AI, and hiring trends seemed to pause in 2H25 and are bouncing back now. Our call would be consistent with 10yr yields in the 4.2-4.5% range. Marking to Market – Estimates for US GDP growth have started to decline toward 2% and inflation expectations are moving lower. 2026 GDP growth forecasts have moved from 2.7% to 2.1% for 2026 and are ~2% for 2027. GDP estimates holding, and actual inflation following inflation expectations lower would be POSITIVE for Non-AI related Cyclicals. Retail stocks, Regional Banks, Airlines and Homebuilders (more on this in the charts).
Changes in some key market-based indicators of economic growth expectations (lower inflation expectations and flatter yields curves) agree with our slowing economy point. But as Peter Williams noted “last week’s financials conference brought a notably upbeat tone on spending, with tentative green shoots among lower-income consumers on top of broad strength. The risk of a second-half deceleration from real income stress and fading tax refunds remain, but layer that onto the new, stronger data, not the more pessimistic view from a few months ago.”
High frequency consumer data points to very little slowdown and would work against our benign slowing of economic growth call. To reinforce, economic growth moving from 3% to 2% IS NOT BAD for risk assets. The market risk reward is less compelling in theory but is still positive. Economic growth is expected to be +2% real and +4% nominal. The Fed will not have a tightening bias under the benign slowdown scenario, which is good. A tightening bias would be bad for risk assets as it would likely be associated with GDP growth estimates well below 2%.
Charts related to the comments above are below.
Indicators – Our call remains that to keep inflation in check GDP growth needs to be at or below 2%, assuming trend productivity holds at roughly 2%. Economic growth estimates have come down.
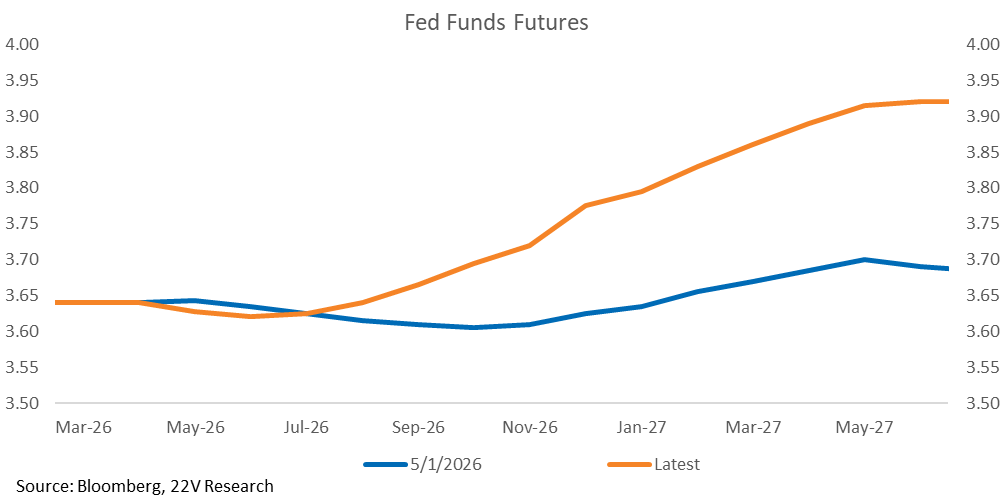
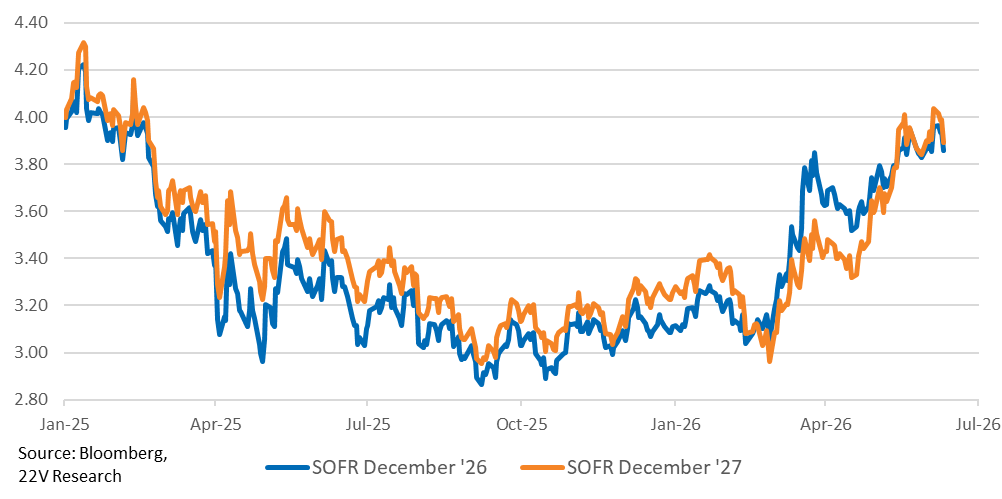
Core inflation estimates increasing is why Fed funds futures are pricing in a Fed on hold. Despite the recent decline in oil prices.
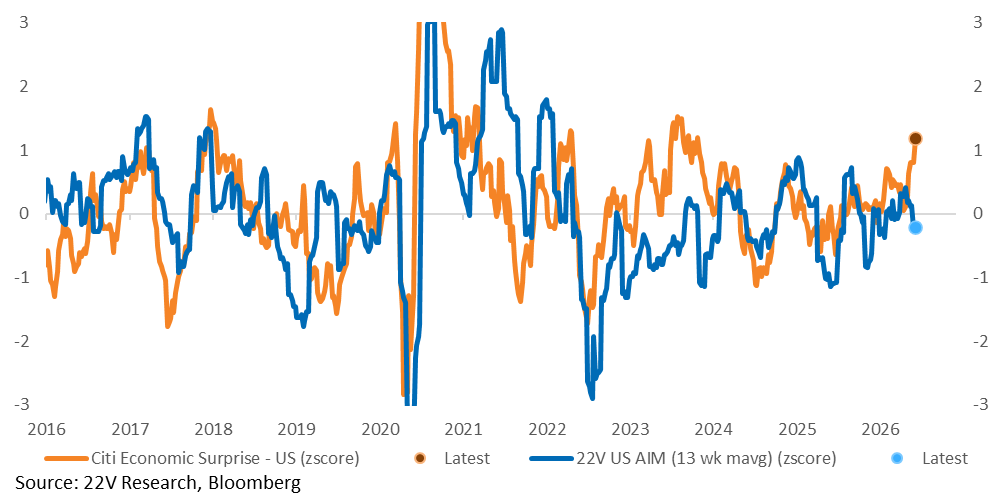
Citi surprise index likely moving lower. Below is the US Citi Surprise index relative to the 22V Economic diffusion index (every data point vs the previous data point). For a number of reasons, economic US Citi surprise index is likely headed lower.
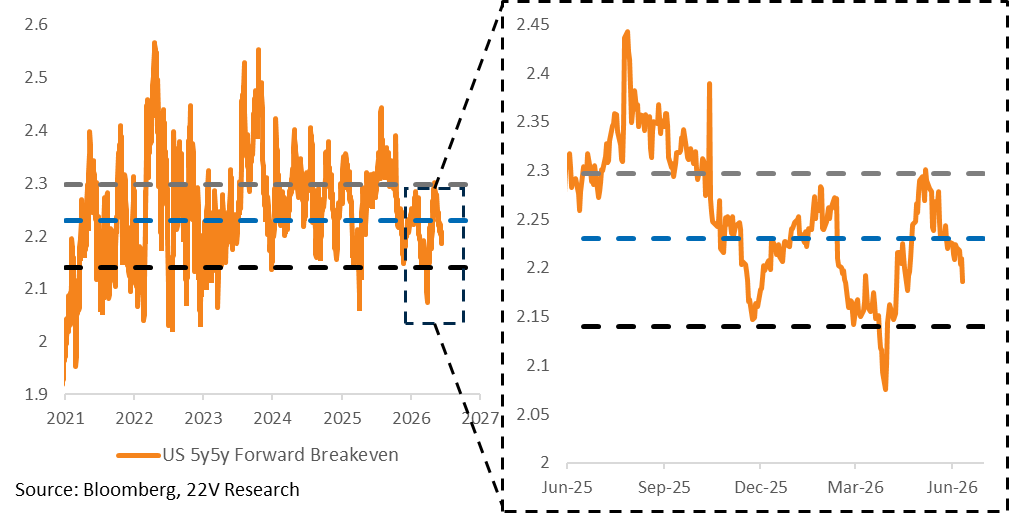
Inflation expectations have been moving lower on a longer term basis.
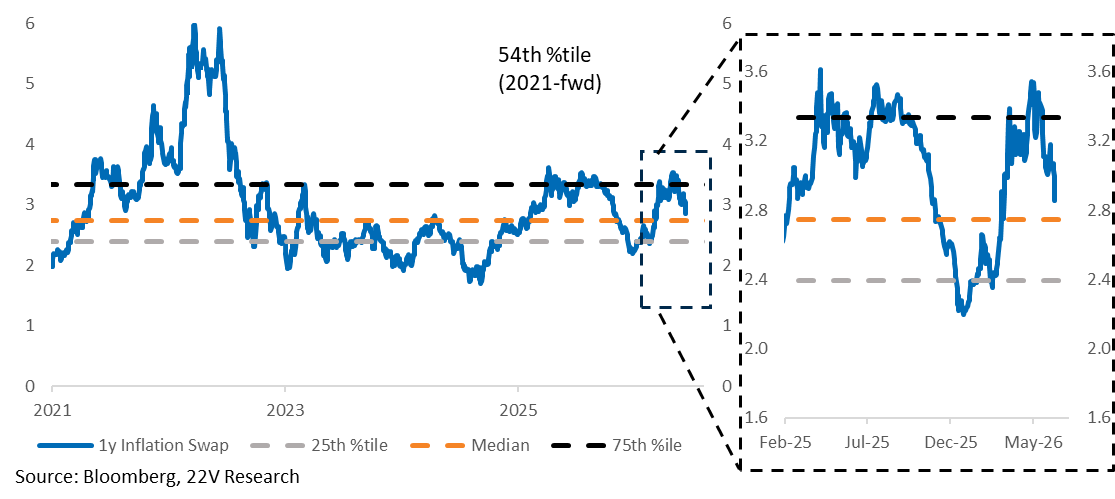
1yr inflation swaps have declined as well, indicating investors are pricing in declining inflation AS the Fed remains on hold. That is not a bad thing as long as GDP growth estimates remain ~>2%.
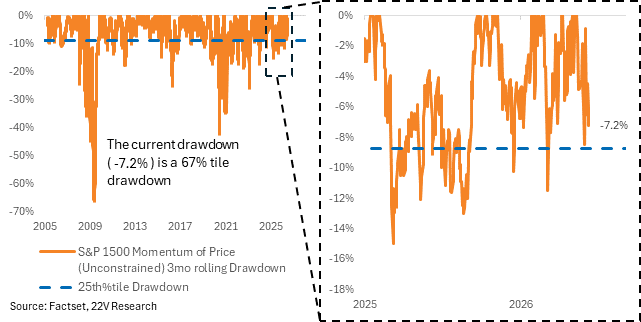
The risk of higher implied real rates (rates – inflation expectations) is weighing on Price Momentum (HERE). Ultimately, if and how much financial conditions must tighten and growth needs to slow depends on the Strait of Hormuz (SOH). The drawdown in Price Momentum is now -7.2%, a 67th percentile drawdown.
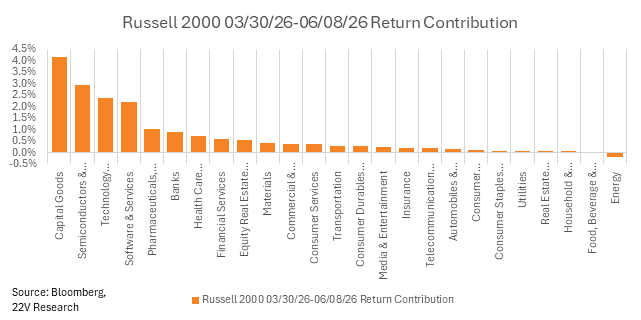
Small caps are a good liquid option to hedge Momentum because they are driven by AI buildout industry groups.
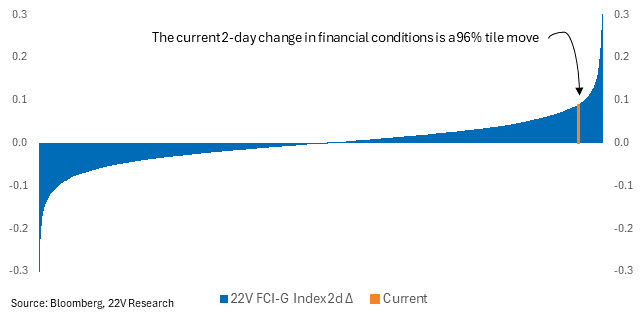
FINANCIAL CONDITIONS: The risk of a VAR shock/broad derisking is still present because financial conditions are still historically easy relative to core inflation (93rd percentile). Inflation is not high enough to warrant a VAR shock/broad derisking unless the Strait of Hormuz remains closed (SOH). With SOH risk reduced, the most likely source of a VAR shock is if the Fed were to signal a tightening cycle (adopt of restrictive bias).
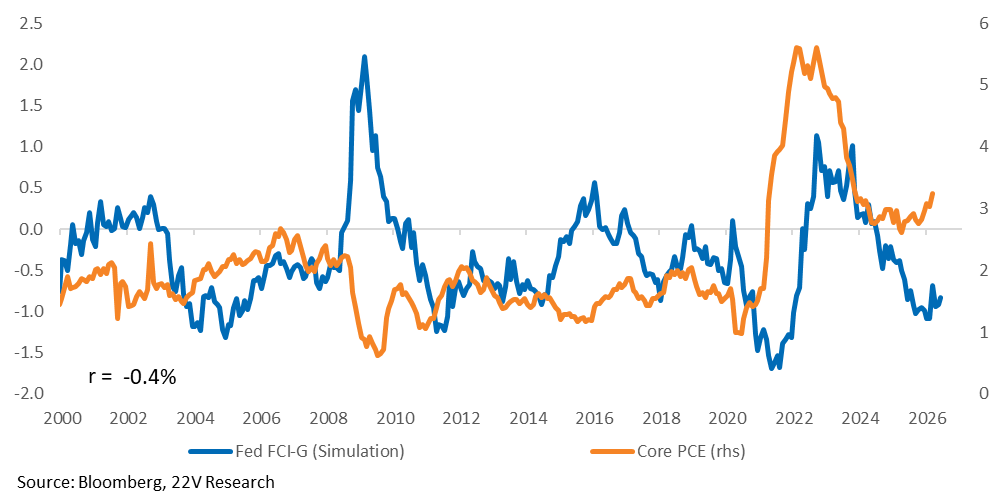
Financial conditions are easy relative to inflation. The gap doesn’t need to close with inflation on its current glide path, assuming a resolution to the supply shocks. The risks to that view, mostly around the SOH, warrant hedging against financial conditions tightening.
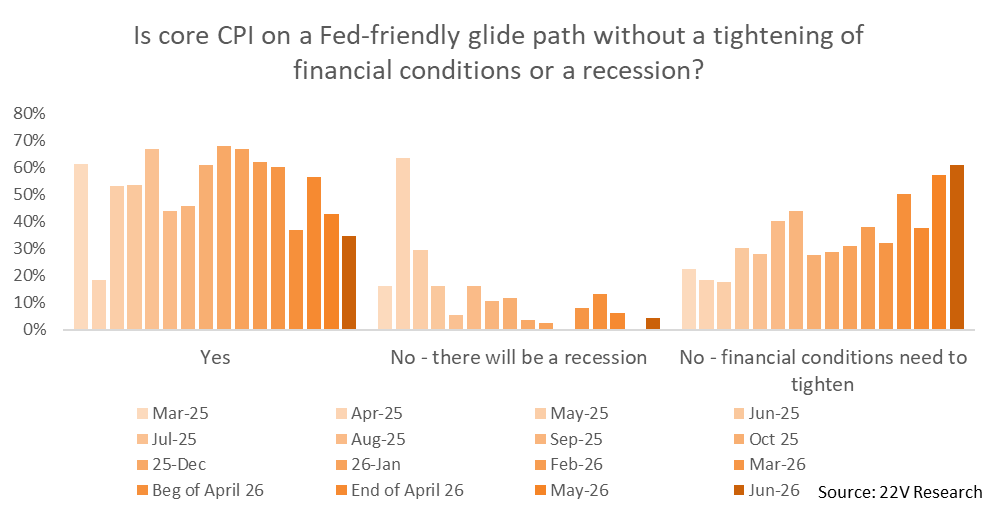
61% of the investors we polled think financial conditions need to tighten to put inflation on a Fed-friendly glide path. That is a new high for our surveys. This helps explain why higher 10yr yields has been associated with negative stock market performance.
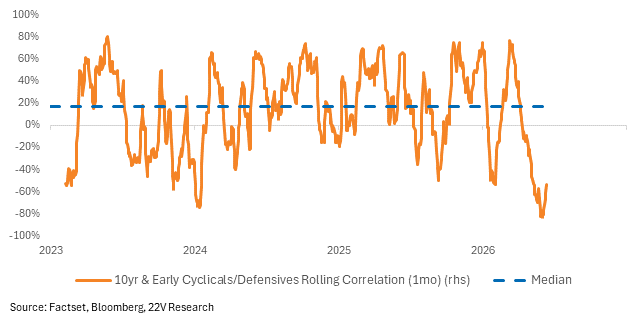
The correlation between 10yr yields and Early Cyclicals (Discretionary, Tech and Communications) relative performance vs Defensives is generally negative. That negative correlation intensified as 10yr yields moved above 4.5%. A level investors associate with increased odds of demand destruction (HERE). Demand destruction would be bad for consumer spending and non-AI related Cyclicals (Retail, Banks, Airlines, Builders) in general.
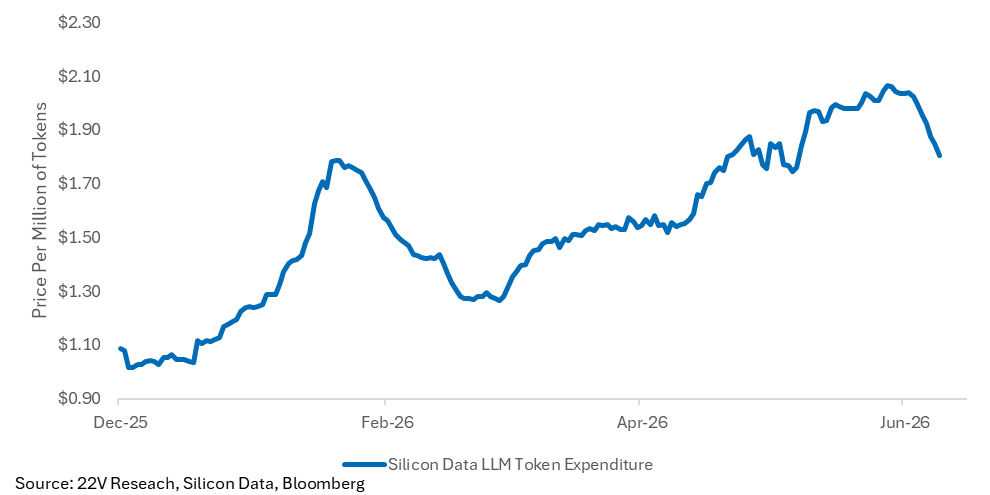
AI UPDATE: The Silicon Data LLM Token Expenditure Index (SDLLMTK), which tracks average prices per million tokens weighted by usage across models, shows a drop in token pricing. Dauvin Peterson, head of 22V’s Data Infrastructure/Commodities research, does not think this is bearish for many areas of the AI story longer-term because it allows scalable AI adoption and embeds the technology more deeply into workflows. The initial reaction has been hitting the buildout trade as investors work through ROI concerns though.
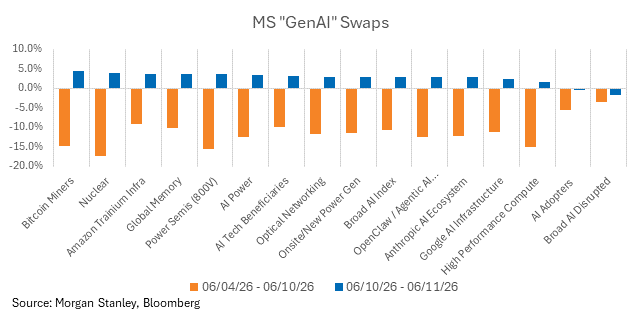
From here, we are tracking the retracement of “Gen AI swaps”. Volatility and event risk remain an issue for these names near term. We have pointed this out in a few reports (HERE) and an article highlighted the vol risk near term. Banks have reportedly raised financing costs for leveraged bets on some popular AI plays. Korean and Taiwanese companies are cited, but the Vol is unusually high for many US names. Reduction in leverage is likely happening in some of the US names as well.
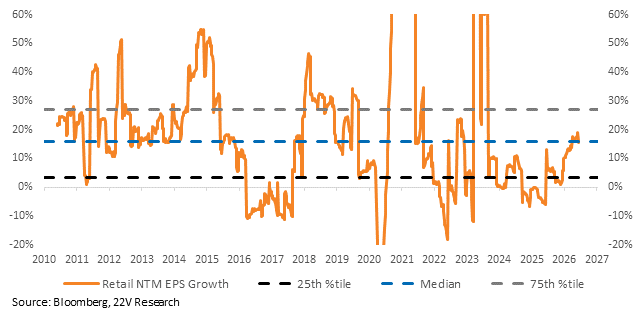
RETAIL: Retail stocks witnessed NTM PE compression despite much stronger than expected consumer spending data and an increase in EPS estimates. NTM EPS estimates have moved from close to zero to start 2026 to +~17% today. Yet the NTM PE compressed.
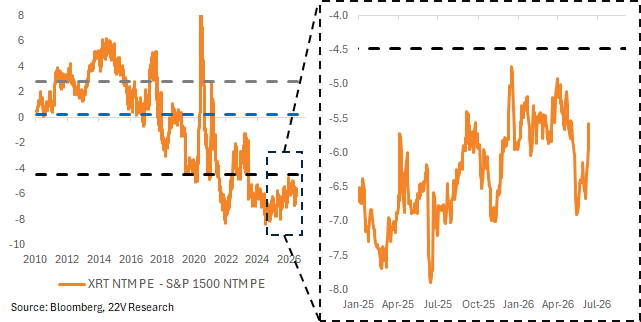
Retail stocks never benefitted from the better than expected consumer spending data and increase in EPS estimates. The increase in interest rates and oil prices weighed on the group. If economic growth moves from the current 3% level to 2%, but 10yr yields stay in a 4.2-4.5% range and inflation expectations decline, that will BENEFIT retail and other Non-AI related Cyclicals. The odds that the economic cycle lengthens increases as inflation moves lower in a non-recessionary way.
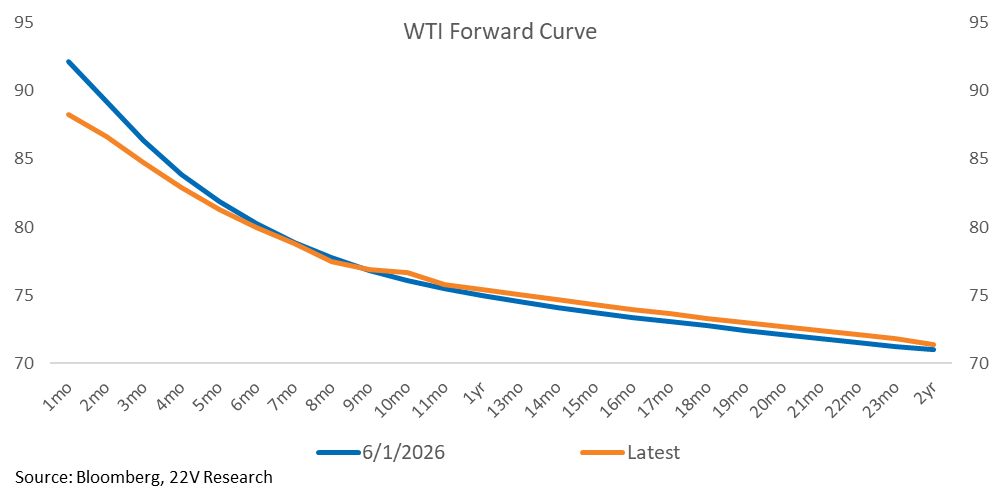
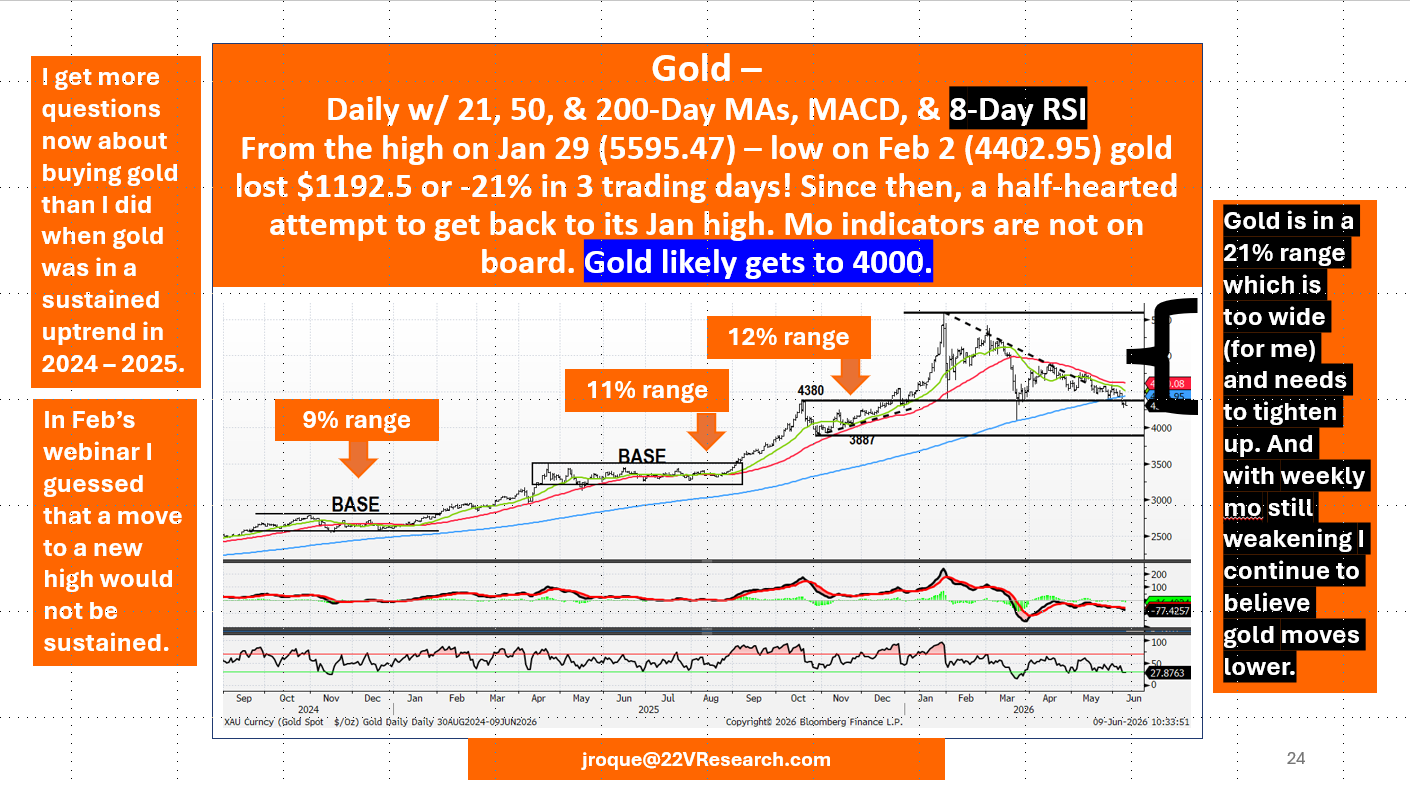
GOLD AND OIL: Gold moving lower suggests higher implied real rates are being priced. That fits with oil prices moving lower, future oil prices expected to decline, inflation expectations moving lower, but Fed fund futures pricing a policy on hold, with a bias to HIKE, over the next 12 months.
From John Roque – I get more questions now about buying gold and silver than I did during 2024 – 2025 when both metals were in sustained uptrends. In short, continued bullish sentiment + deteriorating momentum conditions is, quite often, a situation that is only solved by lower prices
Source: Bloomberg, 22V Research

