

Main point: There is a minor inconsistency between the notion that the breakeven employment growth rate is zero and a comparison of employment growth as measured in the Establishment Survey and the ratios of employment status as measured in the Household Survey. Basically, the labor market does not seem to be tightening quickly enough in response to the employment upturn to ratify the view that the breakeven is in fact zero. For now, this is a puzzle, rather than a justification for assuming that the breakeven growth rate must be higher, as I discuss in this note. The risks around my estimate are to the right, even though I typically try to avoid dragging risks into the economic view. (The central case is hard enough.)
As you will have noticed from the screens, the main news in Friday’s employment report was the beat and upward revision in employment growth.
Other elements of the report were on balance neutral. For example, the index of aggregate hours was slightly light relative to the employment beat, which suggests that there may have been some friendly rounding in the reported path of the average workweek. The marginal beat in wages largely offset that, so what I call the labor income proxy was in line.
Such data do not necessarily justify the repricing we saw, especially if we want to include the move in equities. But it is not unusual for markets to cluster their reaction to an evolving story. The idea the Fed might ease in the coming months has somewhat suddenly become risible, perhaps more so than is even warranted. Warsh. Snigger, snigger. That is about the speed limit, but we did not learn about it just on Friday.[1]
What I want to do in this note is follow up on a point I made on Friday, not because it was the news of the day, but because it was something that interested me in particular. What are we to make of the upturn of employment growth as measured in the Establishment Survey in conjunction with direct measures of labor market tightness which show either little tightening or even some ease — over the past few months and even year? Does this mean that the breakeven employment growth rate is higher than the Fed and I have been assuming, both of us largely taking our cue (apparently) from Wendy Edelberg’s work?
To avoid suspense, my answer involves a party trick that I usually prefer to avoid. That is, I will leave my central case intact but recognize that the risks around it seem to be to the upside. I will continue to model the breakeven as zero but concede that I am more likely slightly low than high.
What I take to be received view inside the Fed as of April
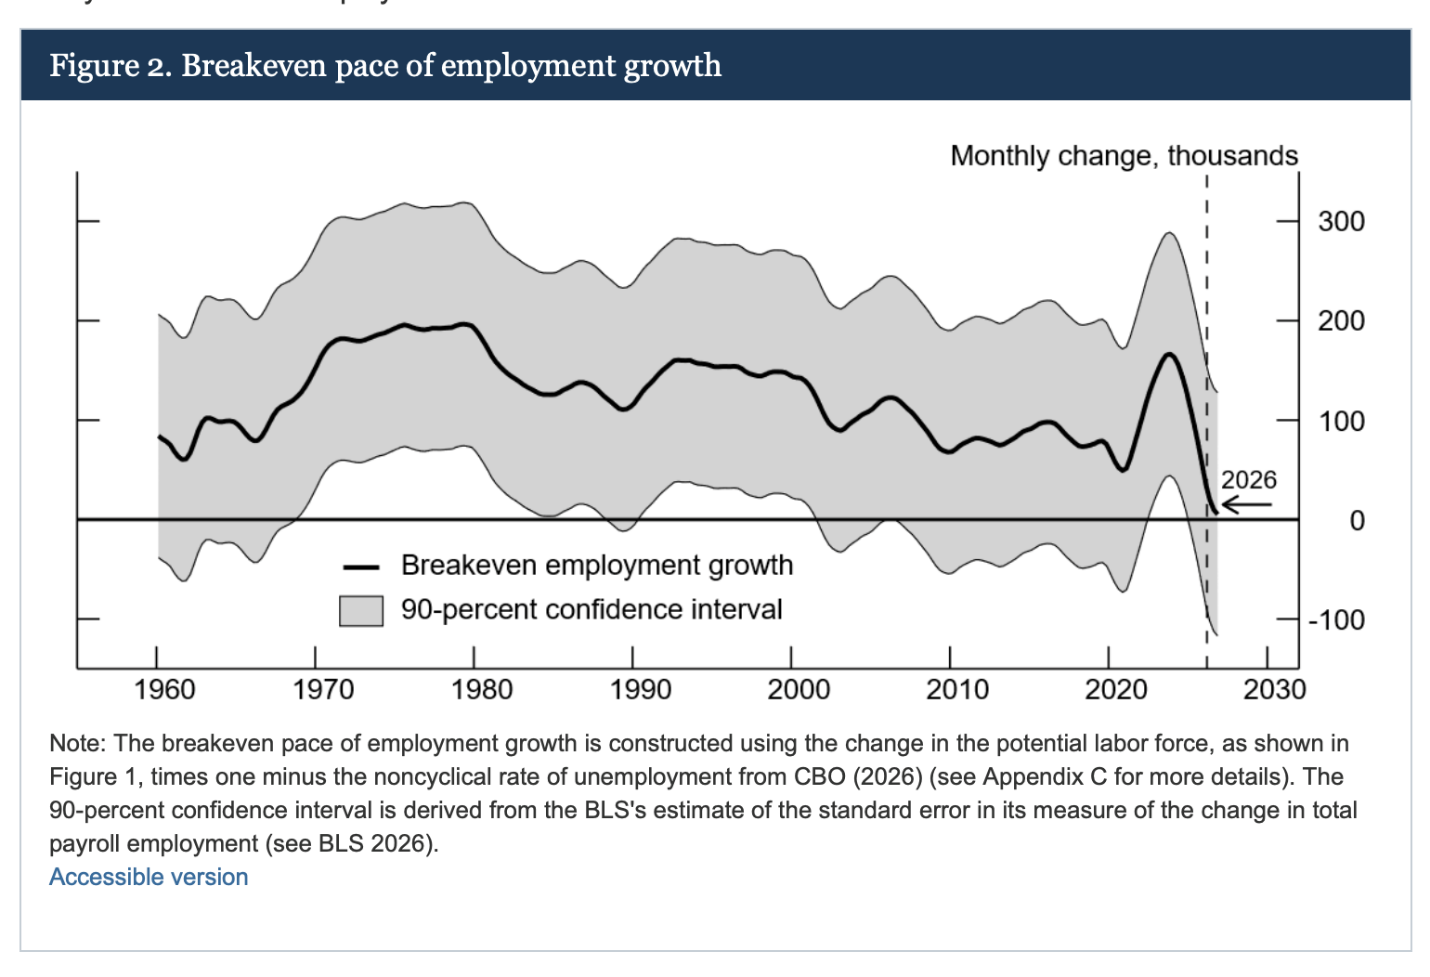
Just to refresh your memory, I anchor (and I think that is a fair term) my best guess in the Fed’s own research, which was presented in a FEDSnotes post in early April. They estimate that the breakeven employment growth rate has fallen from about 1% a few years ago to zero as of this year. Their estimate for 2026 is the same as Wendy Edelberg’s, but they assume a shallower surge during the Biden Administration and therefore a less negative second derivative recently. Note also, in the chart above, that they have a fairly wide confidence interval around this estimate. So, that’s the base case – with which I have been struggling recently.
To see the problem here, let’s start by noting that the Establishment Survey, which produces the headline employment growth figures, results from a direct, if convoluted, sampling of actual employment levels. In contrast, the Household Survey, which gives us the unemployment rate and employ/population ratio (among other things) samples labor market status shares, i.e., the percentages of respondents claiming that they are employed, looking for work, etc. These ratios are then scaled up by estimates of population growth, developed primarily elsewhere in the government and at a much lower frequency, to come up with related levels, such as the Household Survey measure of employment growth, which is always a distantly secondary indicator on job report Friday, because it is so noisy.
If there were no measurement errors or marginal conceptual differences both surveys in the jobs report then a really good proxy of the breakeven employment growth rate would be actual employment growth as measured in the Establishment Survey less the percent (not ppt) change in the employment / population ratio. One advantage of this approach would be that there is no need to bring the population estimates developed elsewhere in the government into the calculation, because the evolving population just cancels out in the algebra. But in practice, everything is measured with so much noise that this approach is totally useless on a 1- and 3-month basis, and still quite dubious even on a 12-month basis.
It is not easy to see an image of a much reduced breakeven here
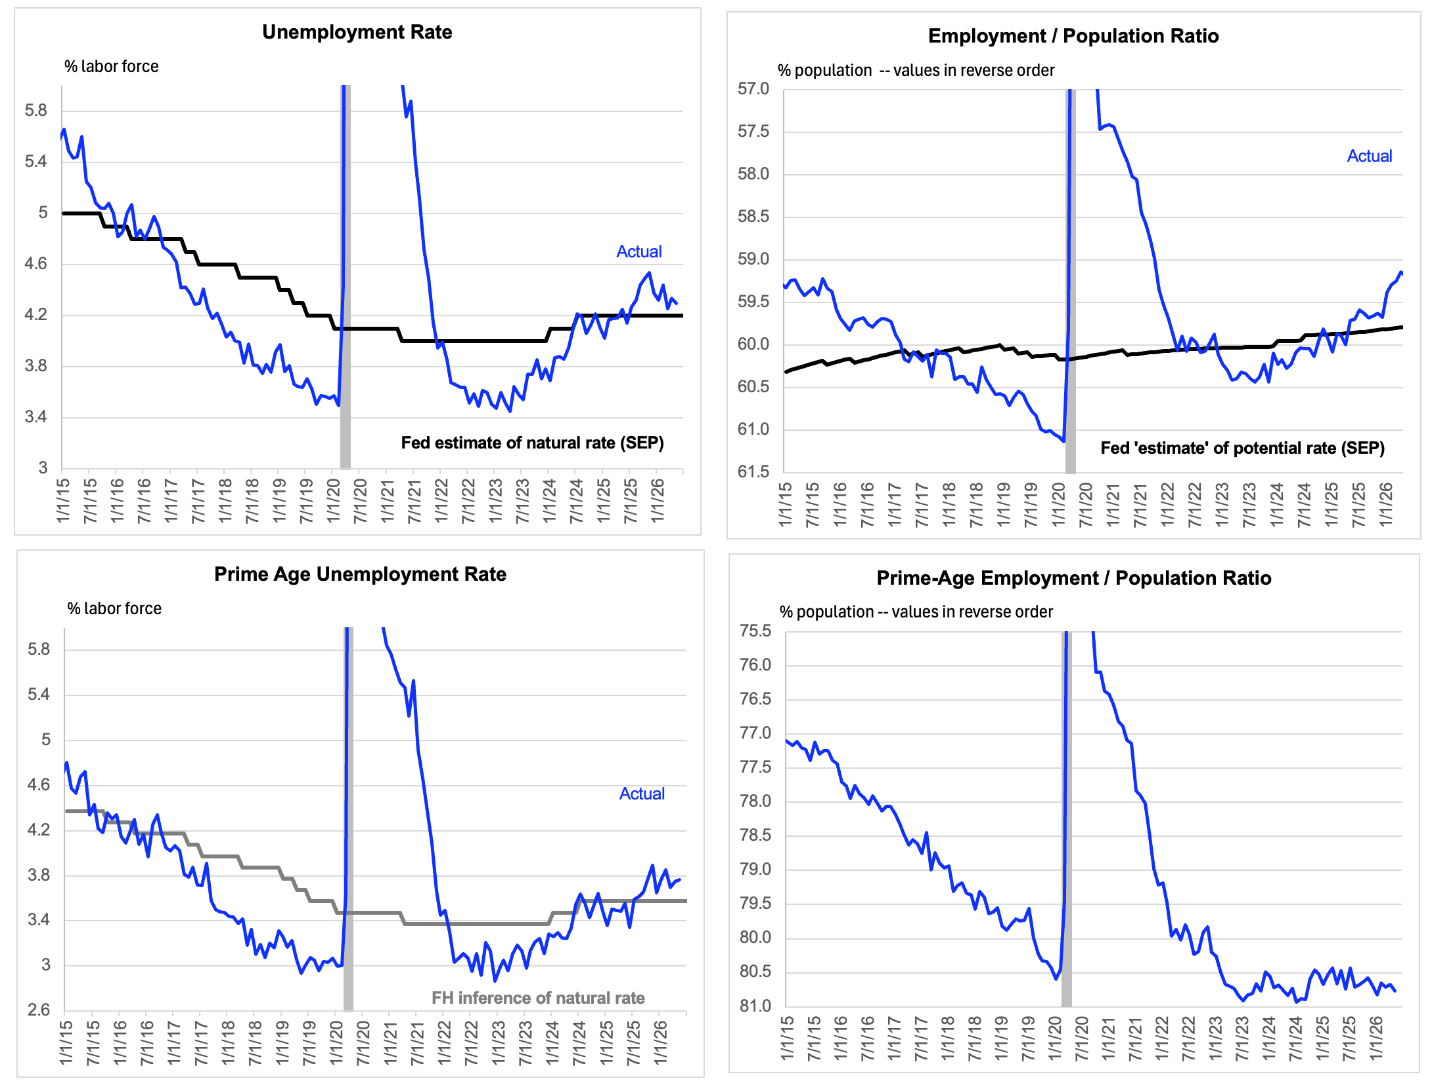
Data are actual to May. Please note that the Fed does not have an estimate of the potential employment / population ratio. What I call their estimate is calculated with their estimate of the natural rate of unemployment and the CBO’s estimate of the potential rate of labor force participation.
Nevertheless, let’s dive in by looking at the 12-month rates. During the twelve months to May, the Establishment Survey shows employment up 0.3%. And the employment / population ratio is recorded as having fallen by 0.9%. Accordingly, we might “back into” the idea that the breakeven employment growth rate has been 1.2%, which is far higher than the Fed and I have assumed using a forward-looking approach that directly measures demographic trends. Incidentally, please note that I generally (exception mentioned below) work here with the employment / population ratio, rather than the unemployment rate, because I treat swings of the participation rate as largely cyclical, which is not controversial. But this analysis is sometimes presented as a comparison of employment growth with the change of the unemployment rate, which is why I show measures of the unemployment rate as well in the chart above. Within that chart the employment / population ratio is shown inverted, in part to make it directly comparable with the unemployment rate. This approach also results in a rising line signaling a stronger breakeven, all else equal.
One issue here, though, is that the performance of the prime-age employment population ratio suggests a very different outcome. During the 12-months to May, the prime age employment / population ratio has risen by just under 0.4%, which fits almost perfectly with the notion that the breakeven employment growth rate is zero. The non-prime employment / population ratio, not shown, has been collapsing, primarily because older men (55 and above, dominated by 65 and above, h/t Employ America) have been dropping out of the labor force.
I think it is plausible to argue that the employment / population ratio is most affected by the demographics swing and that the decline in the participation rate among older Americans is picking up something else, including perhaps the surge in the stock market and other drivers of net worth among the aged. But assuming that is the case does not fully resolve the puzzle here because I am dragging in a second reason for a reduced breakeven, which would leave intact the idea that the demographic work has come to excessively direct conclusions in its own space. It is difficult to get that fly out of my ointment.
For now, I will stick with the idea that the breakeven is zero, while recognizing that there are a couple flies in the ointment. A key consideration here is that direct analysis of the breakeven is probably much more reliable than the cross-check approach that I apply the monthly employment data above.
But even with this, things have to add up. It could be that the Establishment Survey employment data are overstated. Measures of labor market tightness are about right and the directly estimated breakeven is about right, but employment growth is being overstated this year, as during the past two years. Possibly.
My guess, though, is that the household survey measures of labor market tightness are probably understating the tightening recently. An obvious example of this would be the new population controls imposed on the January 2026 data, which reduced the employment / population ratio by 0.5 ppts. The problem with leaning on that is that those controls create a distortion in the specific month of the e/pop change but are not necessarily a problem when making longer-term comparisons. The population controls imposed on 2025 were appropriate to that year on average and the controls imposed on now are appropriate for now.
Accordingly, there would seem to have to be something else going on most likely in those same employment ratios produced in the Household Survey, which – for whatever reason – are slightly understating the recent tightening. It does not mean that I will discount their current signal. But it is how I would stick with the view that the breakeven is probably roughly correctly estimated at around zero – although with a skew to the right.
[1] Incidentally, I have noticed market analysts falling into the bad old habit of inferring the odds of Fed rate hikes and cuts (binary) from futures prices. That is very misleading of what the market thinks, leaving aside whether the market is right or wrong. To do this properly, we need to observe options prices, ideally with the assistance of a market participant who is aware of the various quirks there.

