Back Economics

Update of productivity and cost trends

Published on June 4, 2026

∙ Download the PDF Report

By

Gerard MacDonell

The Productivity and Cost report is seldom market moving. And this morning’s revision to the first quarter data is an example of that. However, the data allow us to monitor slowly moving themes, with the main value added here probably being more a matter of interpretation than of what the newly released figures show. I will be brief.

The underlying trend of productivity growth in the nonfarm business sector continues to run at about 2.1%. That is false precision but it results from passing a trend line through the level of the productivity series, with points of inflection there being subjective but not especially controversial.

No change today in the apparent trend, unsurprisingly
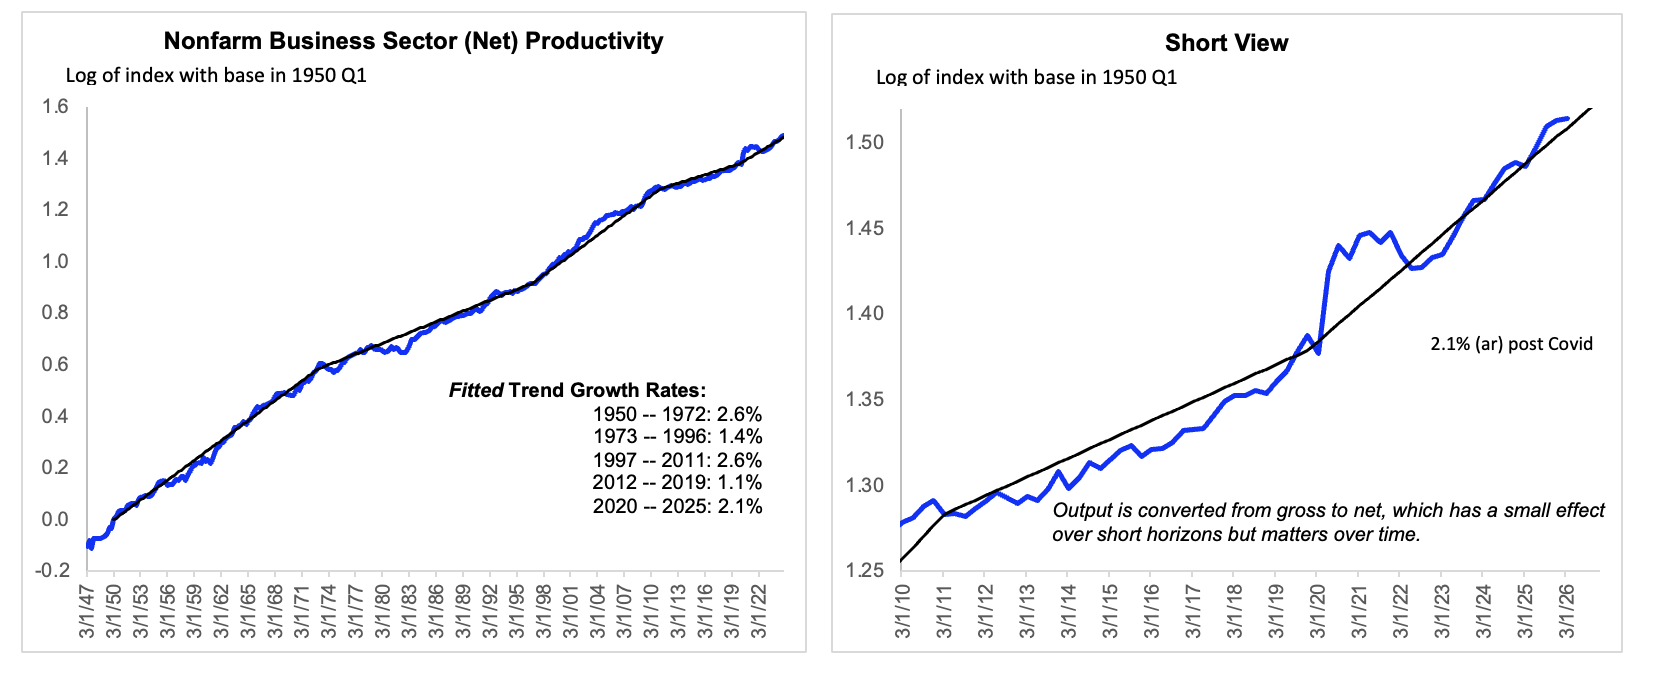
Source: Federal Reserve Bank of St. Louis (FRED), FH calculations and inferences
Data are actual to 2026 Q1.

While the recent apparently doubling of trend productivity growth has been impressive, this fits into my view that the speed limit for overall GDP growth for the next few quarters is likely to be 2% or lower. If non-farm business sector productivity growth is running at 2.1%, then economy-wide is probably closer to 1 ¾%. Meanwhile, potential employment growth is apparently quite low because of the demographics shift, although this will be an issue around which we will have to keep an open mind. (The recent data seem to involve insufficient labor market tightening for the consensus estimate, of zero potential employment growth, to hold.) Meanwhile, the Fed will want to avoid a renewed tightening of the labor market with the economy already within measurement error of full employment and with underlying (e.g., ex-tariff) inflation, even generously interpreted, running at least ½ a percentage point above target.

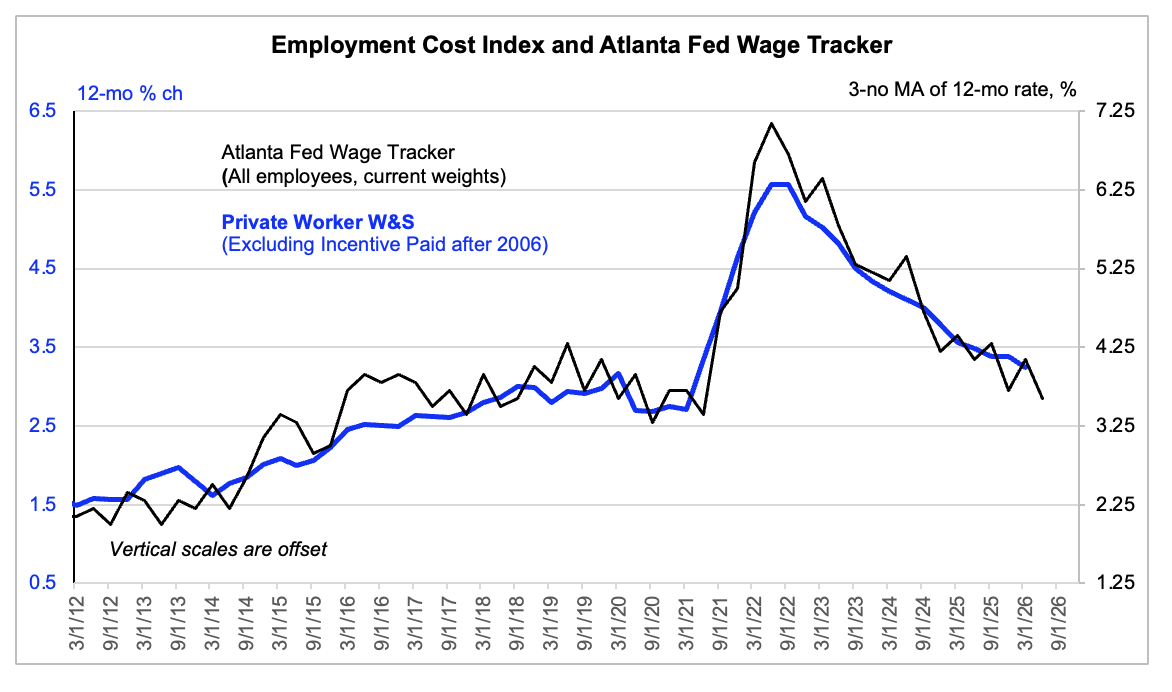
ECI suggests that underlying AHC growth is around 4%
A graph showing the cost of a wage tracker

AI-generated content may be incorrect.
Source: Federal Reserve Banks of Atlanta and St. Louis (FRED), FH calculations
ECI is actual to March. The Wage Tracker is actual to April and is shown for reference, suggesting ECI may still be slowing.

This morning’s data show that measured unit labor cost (ULC) inflation ran at just 0.5% during the four quarters ending in March. There is a sense in which that is quite relevant, as I will get to below. However, the measured ULC inflation data are extremely noisy because both measured productivity and measured average hourly compensation (AHC) are noisy even when measured at a 4-quarter rate. It is probably best, then, to think of the underlying trend of AHC inflation implied by the Employment Cost Index (ECI) and then subtract trend productivity growth from that. Core ECI inflation is apparently running at just over 3%, which would map to 4% growth in trend AHC, given that AHC tends to rise almost a percentage point quicker over time than the ECI. That implies underlying ULC growth of 2%, which fits quite neatly into a very wide range of data suggesting it is very difficult to trace the current inflation overshoot to the labor market or to the Phillips Curve construct more generally. But just because the inflation does not fit the standard model does not mean it is necessarily transitory.

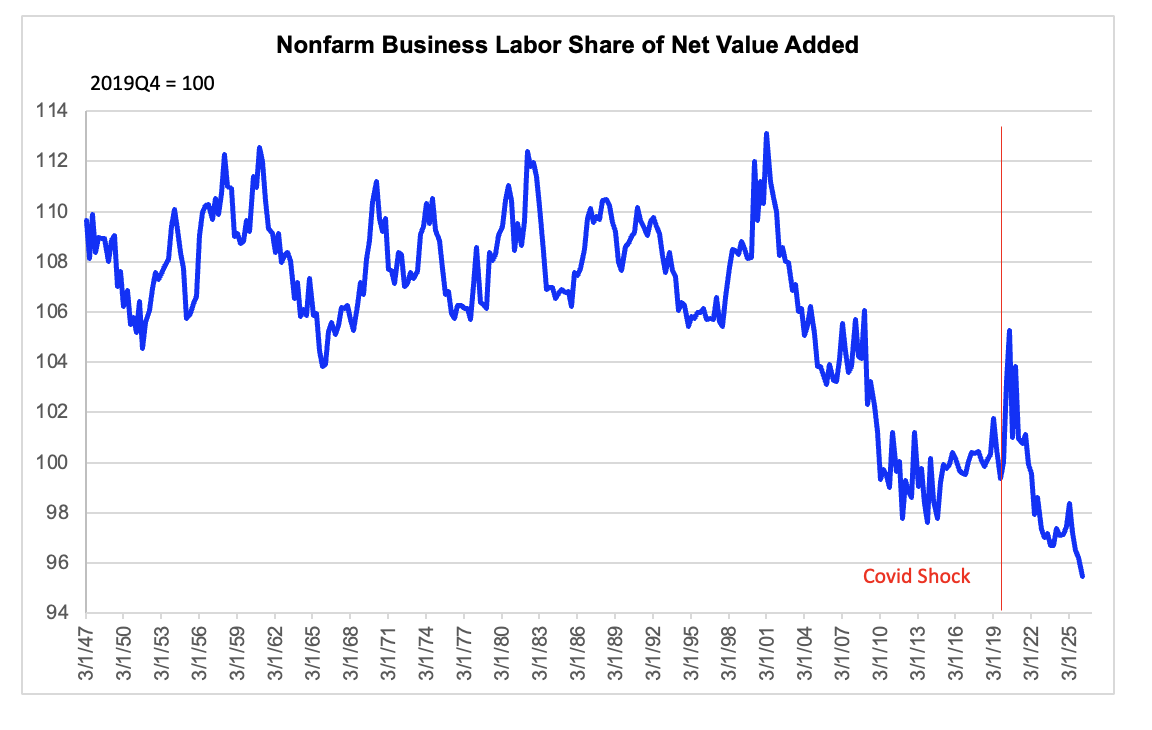
Labor share at record low
A graph of a business

AI-generated content may be incorrect.
Source: Federal Reserve Bank of St. Louis (FRED), FH calculations
Data are actual to 2026 Q1.

While the measured ULC data are too volatile to allow us to infer an underlying inflation trend from their behavior, the ratio of ULCs to the value added deflator in the nonfarm business sector is – by definition – an index of the labor market share. To see this, just multiply both the nominator and the denominator there by real output. And when this is expressed in level terms it would seem to contain very relevant information. To wit, the labor share has fallen steeply in recent quarters, including since the Covid shock, and is now at a record low.

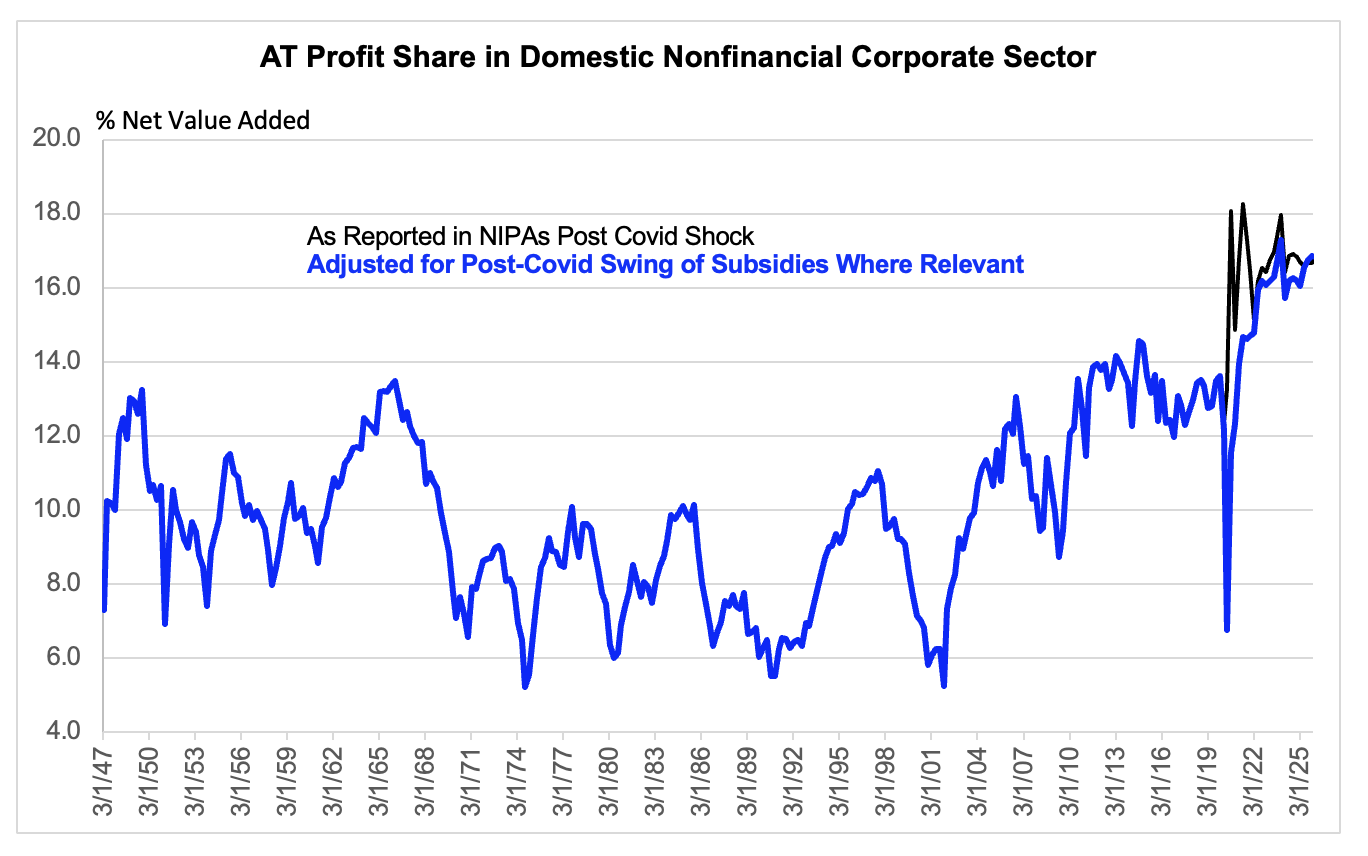
There are two ways of interpreting this. First, it may be evidence that there is room for businesses to absorb higher labor costs into margins rather than passing them on in the form of inflation – were higher labor costs to develop. Second, looking more strictly backward, this has been the main force driving the after-tax profit margin in the nonfinancial corporate sector to an all-time high, as we saw confirmed in last week’s revised National Accounts. Back in the day, the bears used to warn about profit margin mean reversion. But people have pretty much given up on that idea, which I would view as an advance, because structural changes in the economy can affect the “mean” to which margins would presumably revert.

Record wide margins on domestic operations
A graph showing the number of companies

AI-generated content may be incorrect.
Source: BEA, FH calculations
Data are actual to 2026 Q1.

DISCLOSURES AND DISCLAIMERS

Analyst Certification

The analyst, 22V Research Group, primarily responsible for the preparation of this research report attests to the following: (1) that the views and opinions rendered in this research report reflect his or her personal views about the subject companies or issuers; and (2) that no part of the research analyst’s compensation was, is, or will be directly related to the specific recommendations or views in this research report.

Analyst Certifications and Independence of Research.

Each of the 22V Research analysts whose names appear on the front page of this report hereby certify that all the views expressed in this Report accurately reflect our personal views about any and all of the subject securities or issuers and that no part of our compensation was, is, or will be, directly or indirectly, related to the specific recommendations or views of in this Report.

22V Research (the “Company”) is an independent research provider. The Company is not a member of the FINRA or the SIPC and is not a registered broker dealer or investment adviser. 22V Research has no other regulated or unregulated business activities which conflict with its provision of independent research.

22V Research, LLC is a professional services and independent publication organization. 22V Research, LLC is not a securities broker-dealer, not a member of the Financial Industry Regulatory Authority (FINRA), not a registered investment advisor (RIA) and not a member of SIPC.

Securities transactions, when offered, are offered by 22V Securities, LLC through LPS Capital, LLC. Certain employees of 22V Securities, LLC are dually registered as securities representatives of LPS Capital, LLC or Analyst Hub Securities, LLC. 22V Securities, LPS Capital and Analyst Hub Securities are members FINRA, SIPC.

https://brokercheck.finra.org/

Current Ratings Definition.

SECTOR OUTPERFORM: An “outperform” rating anticipates the company will outperform the S&P Regional Banking Index (peer group).

SECTOR PERFORM: A “market perform” rating anticipates the company will perform in line with the S&P Regional Banking Index (peer group).

SECTOR UNDERPERFORM: An “underperform” rating anticipates the company will underperform the S&P Regional Banking Index (peer group).

Limitation Of Research And Information.

This Report has been prepared for distribution to only qualified institutional or professional clients of 22V Research Group. The contents of this Report represent the views, opinions, and analyses of its authors. The information contained herein does not constitute financial, legal, tax or any other advice. All third-party data presented herein were obtained from publicly available sources which are believed to be reliable; however, the Company makes no warranty, express or implied, concerning the accuracy or completeness of such information. In no event shall the Company be responsible or liable for the correctness of, or update to, any such material or for any damage or lost opportunities resulting from use of this data. Nothing contained in this Report or any distribution by the Company should be construed as any offer to sell, or any solicitation of an offer to buy, any security or investment. Any research or other material received should not be construed as individualized investment advice. Investment decisions should be made as part of an overall portfolio strategy and you should consult with a professional financial advisor, legal and tax advisor prior to making any investment decision. 22V Research Group shall not be liable for any direct or indirect, incidental or consequential loss or damage (including loss of profits, revenue or goodwill) arising from any investment decisions based on information or research obtained from 22V Research Group.

Reproduction And Distribution Strictly Prohibited.

No user of this Report may reproduce, modify, copy, distribute, sell, resell, transmit, transfer, license, assign or publish the Report itself or any information contained therein. Notwithstanding the foregoing, clients with access to working models are permitted to alter or modify the information contained therein, provided that it is solely for such client’s own use. This Report is not intended to be available or distributed for any purpose that would be deemed unlawful or otherwise prohibited by any local, state, national or international laws or regulations or would otherwise subject the Company to registration or regulation of any kind within such jurisdiction.

Copyrights, Trademarks, Intellectual Property.

22V Research Group, and any logos or marks included in this Report are proprietary materials. The use of such terms and logos and marks without the express written consent of 22V Research Group is strictly prohibited. The copyright in the pages or in the screens of the Report, and in the information and material therein, is proprietary material owned by 22V Research Group unless otherwise indicated. The unauthorized use of any material on this Report may violate numerous statutes, regulations and laws, including, but not limited to, copyright, trademark, trade secret or patent laws.
