Back Portfolio Strategy

What a Hawkish Fed Bias Would Look Like + AI Capex Era Cash Return Likely to be Better than Feared

Published on May 27, 2026

∙ Download the PDF Report

By

Dennis DeBusschere

Kevin Brocks

Sophia Wang

DAILY STRATEGY: We got pushback against our view that the market isn’t pricing a hawkish bias; investors pointed to a rate hike already priced in by March 2027. Our point is that a rate hike reflects a higher neutral rate of interest. A hawkish bias would mean the Fed attempting to force GDP growth lower (to well below 2%), accepting the higher recession risk associated with that. Equity markets would have downside risk, and the riskiest factors (Earnings Vol, Price Mo, Leverage, Small size) would underperform. That is not the case now.

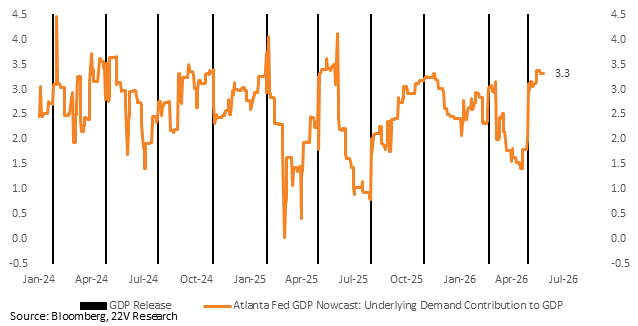
The rate hike that is priced is meant to set the policy closer to neutral, meaning a level that is neither stimulative nor restrictive. The appropriate neutral rate appears to be higher because the economy has proven more resilient than expected to the Iran war. The Atlanta Fed GDPNowcast is currently tracking +3.3% “core” GDP growth (consumption + investment) for 2Q. We cover the details in full in a short video HERE.

For the Fed shifting to a hawkish bias, meaning setting policy that is restrictive, would likely require a series of high inflation prints over the summer (roughly a series of 0.3s on core inflation) to bring the Fed’s 2026 forecast close to 3.5%. June-September prints will be very important.

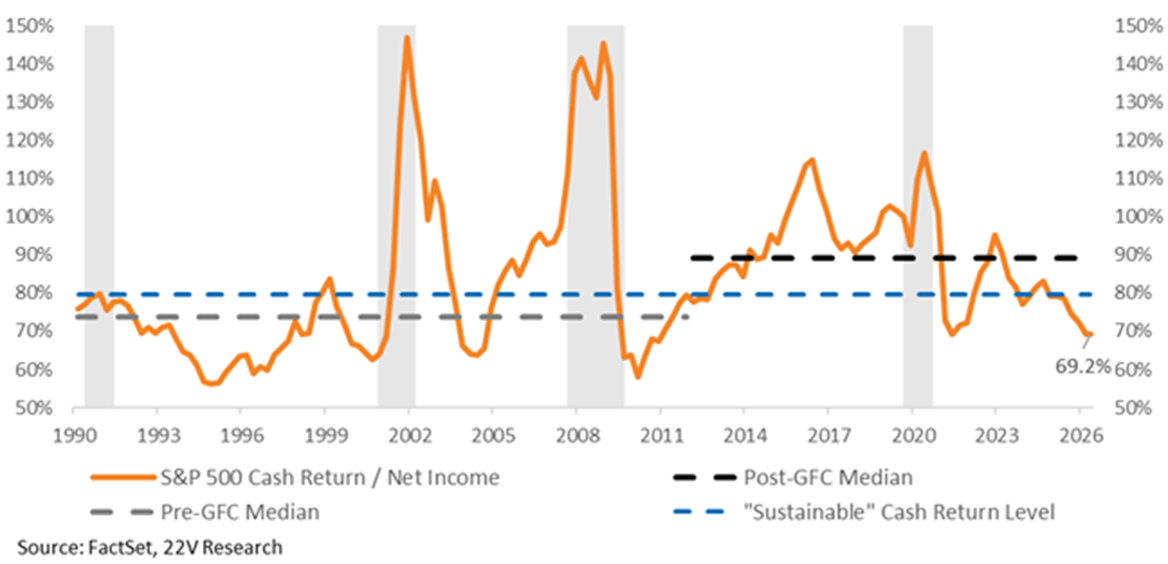
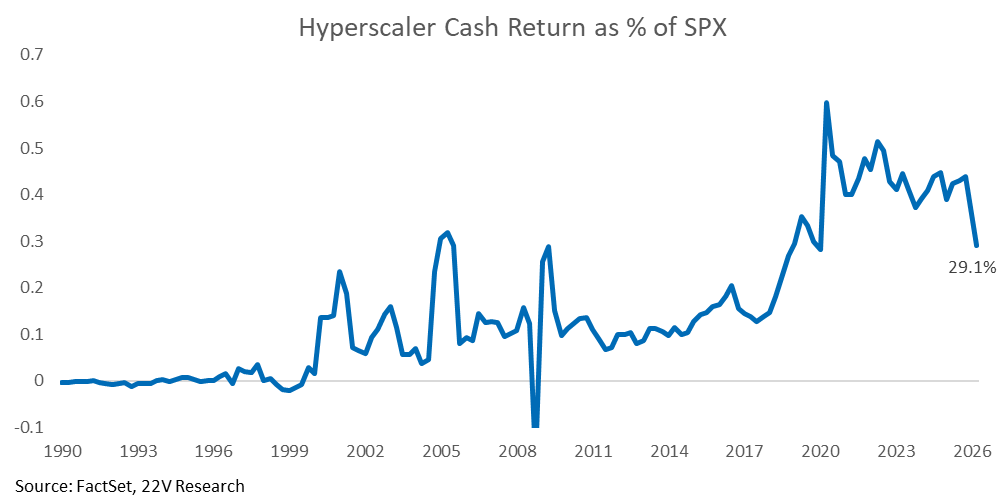
CASH RETURN: We model fair value for the S&P 500 by discounting expected cash return (dividends + buybacks). Cash return as a percentage of net income has declined as Hyperscalers redirect toward AI capex, weighing on fair value estimates. Investors are concerned that the persistent competition between Hyperscalers could impair cash returns for years. However, NVDA’s earnings highlighted a more optimistic case to consider even if Hyperscaler cash return remains impaired. NVDA is returning more of its revenue, partly from Hyperscaler spend, to investors.

Ben Thompson, a well followed Tech blogger and podcaster, flagged that NVDA intends to return 50% of its free cash flow to shareholders this year. Based on NVDA’s guidance, that implies cash return roughly doubling from its trailing twelve month reading ($54B to $111B, +$57 billion). NVDA doubling its cash return would add another 50bps to the S&P 500’s total cash return ratio.

The implications are broader. If Hyperscaler spending flows to companies who then increase cash return – chip makers, energy providers, companies involved in the data center buildout – the net outcome could be a rebound in the S&P’s cash return. The practical implication would be long the S&P 500.

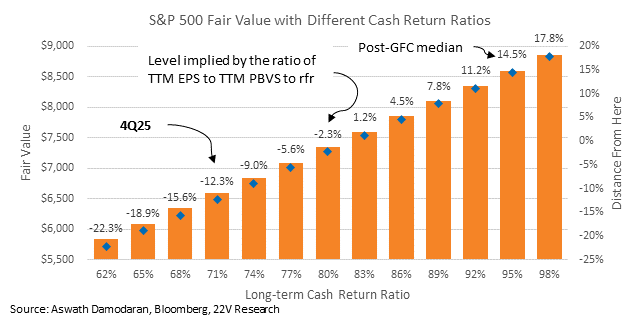
We chart out S&P 500 fair value under different cash return ratios below.

Charts…

The Atlanta Fed’s GDPNowcast for underlying demand – personal consumption and fixed investment – is tracking +3.3% for 2Q. A hawkish bias would mean the Fed attempting to force GDP growth well below 2%.
Cash return (dividends + buybacks/net income) dropped in 4Q to its lowest level since the immediate aftermath of COVID and the GFC as Hyperscalers pivoted away from cash return.
A graph of a graph showing the growth of the company's income

AI-generated content may be incorrect.

A graph of a graph

AI-generated content may be incorrect.

Investors are concerned about cash return from Hyperscalers remaining impaired. IF cash return stays at its 4Q level in perpetuity, fair value is another -12% lower from here. However, there’s upside IF cash return rebounds, and NVDA’s dividend and buyback announcements highlight an underappreciated way cash return can rebound even if Hyperscalers are stuck in a prolonged spending battle.
A graph of a graph with numbers and arrows

AI-generated content may be incorrect.

In our model, we assume cash return returns to a “sustainable” level implied by ROE. Basically, given ttm earnings and book value, the index retains the necessary earnings to grow future earnings at the terminal rate, returning the rest as cash. The index has frequently had a cash return ratio above this level.
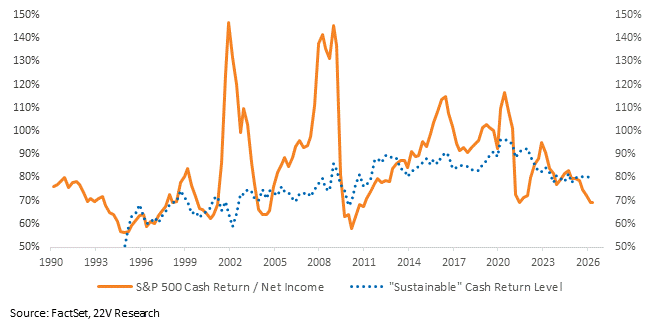
A graph of a graph of a graph of a graph of a graph of a graph of a graph of a graph of a graph of a graph of a graph of a graph of a graph of

AI-generated content may be incorrect.

For Fair Value estimates, we use a cash return model based on Aswath Damodaran’s methodology. Great resource on this HERE. Table demonstrating the calculation below.
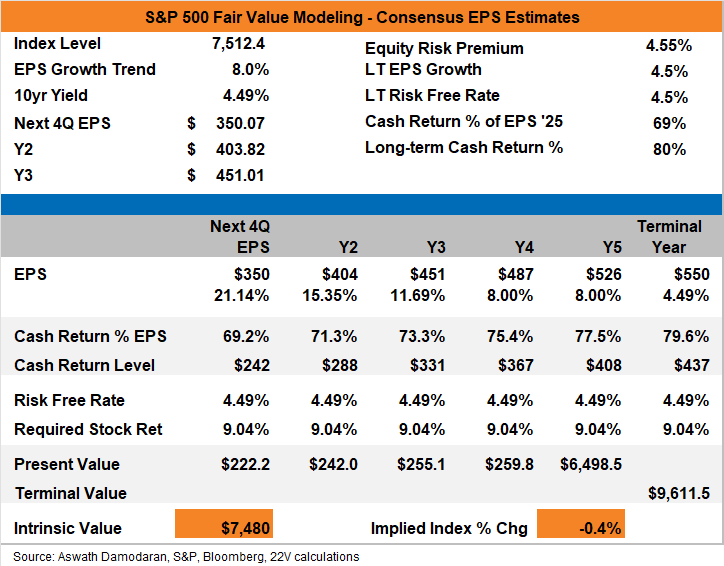
A screenshot of a graph

AI-generated content may be incorrect.

DISCLOSURES AND DISCLAIMERS

Analyst Certification

The analyst, 22V Research Group, primarily responsible for the preparation of this research report attests to the following: (1) that the views and opinions rendered in this research report reflect his or her personal views about the subject companies or issuers; and (2) that no part of the research analyst’s compensation was, is, or will be directly related to the specific recommendations or views in this research report.

Analyst Certifications and Independence of Research.

Each of the 22V Research analysts whose names appear on the front page of this report hereby certify that all the views expressed in this Report accurately reflect our personal views about any and all of the subject securities or issuers and that no part of our compensation was, is, or will be, directly or indirectly, related to the specific recommendations or views of in this Report.

22V Research (the “Company”) is an independent research provider. The Company is not a member of the FINRA or the SIPC and is not a registered broker dealer or investment adviser. 22V Research has no other regulated or unregulated business activities which conflict with its provision of independent research.

22V Research, LLC is a professional services and independent publication organization. 22V Research, LLC is not a securities broker-dealer, not a member of the Financial Industry Regulatory Authority (FINRA), not a registered investment advisor (RIA) and not a member of SIPC.

Securities transactions, when offered, are offered by 22V Securities, LLC through LPS Capital, LLC. Certain employees of 22V Securities, LLC are dually registered as securities representatives of LPS Capital, LLC or Analyst Hub Securities, LLC. 22V Securities, LPS Capital and Analyst Hub Securities are members FINRA, SIPC.

https://brokercheck.finra.org/

Current Ratings Definition.

SECTOR OUTPERFORM: An “outperform” rating anticipates the company will outperform the S&P Regional Banking Index (peer group).

SECTOR PERFORM: A “market perform” rating anticipates the company will perform in line with the S&P Regional Banking Index (peer group).

SECTOR UNDERPERFORM: An “underperform” rating anticipates the company will underperform the S&P Regional Banking Index (peer group).

Limitation Of Research And Information.

This Report has been prepared for distribution to only qualified institutional or professional clients of 22V Research Group. The contents of this Report represent the views, opinions, and analyses of its authors. The information contained herein does not constitute financial, legal, tax or any other advice. All third-party data presented herein were obtained from publicly available sources which are believed to be reliable; however, the Company makes no warranty, express or implied, concerning the accuracy or completeness of such information. In no event shall the Company be responsible or liable for the correctness of, or update to, any such material or for any damage or lost opportunities resulting from use of this data. Nothing contained in this Report or any distribution by the Company should be construed as any offer to sell, or any solicitation of an offer to buy, any security or investment. Any research or other material received should not be construed as individualized investment advice. Investment decisions should be made as part of an overall portfolio strategy and you should consult with a professional financial advisor, legal and tax advisor prior to making any investment decision. 22V Research Group shall not be liable for any direct or indirect, incidental or consequential loss or damage (including loss of profits, revenue or goodwill) arising from any investment decisions based on information or research obtained from 22V Research Group.

Reproduction And Distribution Strictly Prohibited.

No user of this Report may reproduce, modify, copy, distribute, sell, resell, transmit, transfer, license, assign or publish the Report itself or any information contained therein. Notwithstanding the foregoing, clients with access to working models are permitted to alter or modify the information contained therein, provided that it is solely for such client’s own use. This Report is not intended to be available or distributed for any purpose that would be deemed unlawful or otherwise prohibited by any local, state, national or international laws or regulations or would otherwise subject the Company to registration or regulation of any kind within such jurisdiction.

Copyrights, Trademarks, Intellectual Property.

22V Research Group, and any logos or marks included in this Report are proprietary materials. The use of such terms and logos and marks without the express written consent of 22V Research Group is strictly prohibited. The copyright in the pages or in the screens of the Report, and in the information and material therein, is proprietary material owned by 22V Research Group unless otherwise indicated. The unauthorized use of any material on this Report may violate numerous statutes, regulations and laws, including, but not limited to, copyright, trademark, trade secret or patent laws.
