

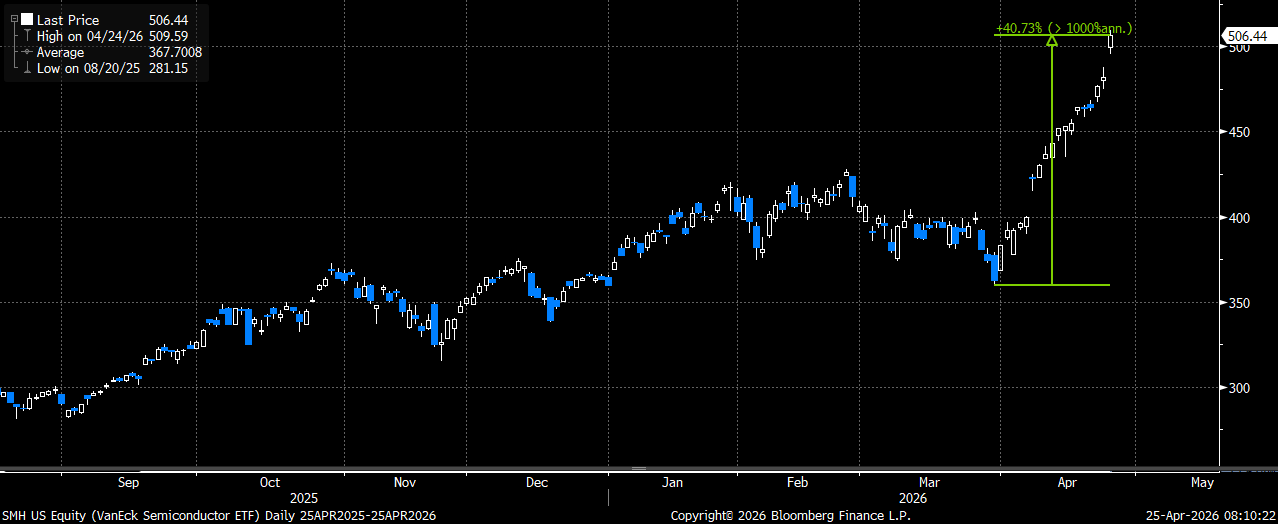
The markets were up for a fourth straight week, once again led by the tech/AI trade. The tech-heavy QQQ was up 2.3%, far outpacing the gains in the SPX (+0.5%) and small caps (+0.3%). The semiconductor stocks were the real stars, gaining more than 9% for the week, led by AMD (+25%), INTC (+20.5%) and TXN (+20.6%). The main semi ETF (SMH) is now up more than 40% just since the lows on 3/30 and has had exactly ONE down day since then (a whopping 0.04% decline on 4/20). Even with other areas of the market taking a bit of a breather last week, the massive rally in the chips continues to propel the indices to new highs.
SMH up an incredible 40%+ just since the March lows
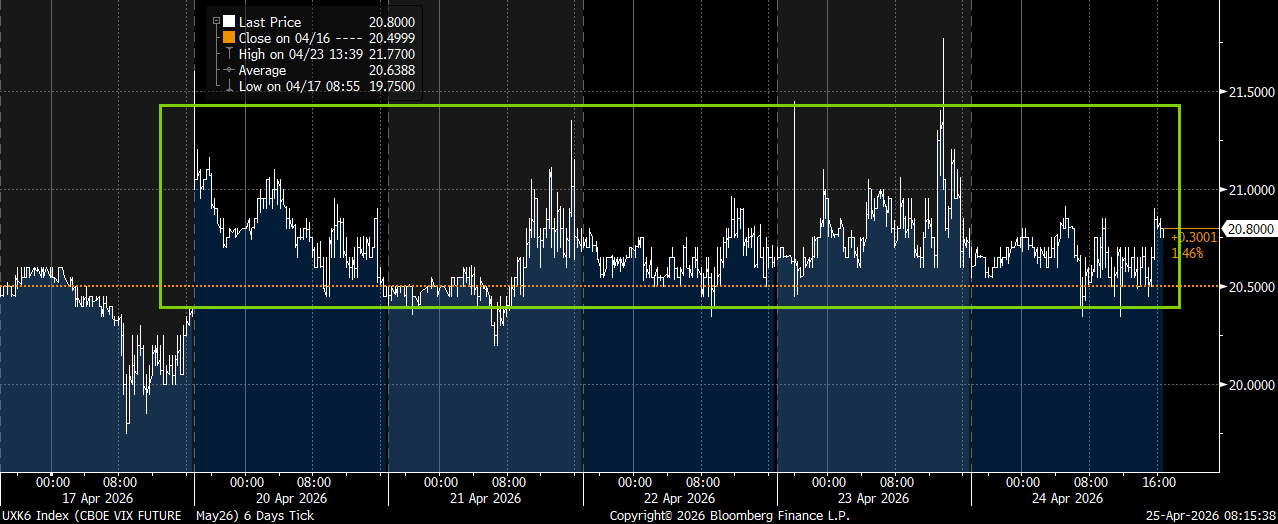
A portfolio hedge trade I have suggested repeatedly (owning VIX May call spreads) continues to perform really well as the market continues its ascent higher. The VIX May futures ended the week higher, even though SPY, QQQ and IWM all were up for the week. The inability for the VIX to move meaningfully lower from these levels, especially as markets rally, continues to work in the favor of investors who own the May 19th VIX call spread as a tail-risk portfolio hedge. The May 19th VIX 23/45 call spread I suggested in my note last week that cost ~ $1 ended the week worth slightly more than that $1 cost. The comparable SPY 40-delta May 15th put lost ~ 15% on the week, mostly because of the delta move lower as the SPX gained another half-percent. With about three weeks until the May VIX options expire, I still believe you can own these call spreads as a macro hedge, as long as they are rolled out to a comparable June structure about a week before expiration (should we not see a meaningful bump in volatility before then)
The May VIX futures ended the week higher, even though markets were up for a fourth straight week
Focusing on non-tech sector hedges
As I mentioned above, we did start to see some weakness in the non-tech areas of the market last week. Banks, healthcare, industrials and retailers all ended the week lower. Perhaps they are just taking a break after a sharp move off the March lows, or maybe we are now starting to see these sectors being sold as people go “all-in” on the tech/AI trade? Whatever the reason, the absolute (and relative) weakness in the non-tech areas of the market means low-cost sector hedges should now be considered. Earlier in the week I mentioned the large-cap biotech (IBB) sector as a candidate to establish cheap hedges in (here), I now want to turn my attention to the financials as another area I would look to add tactical hedges in.
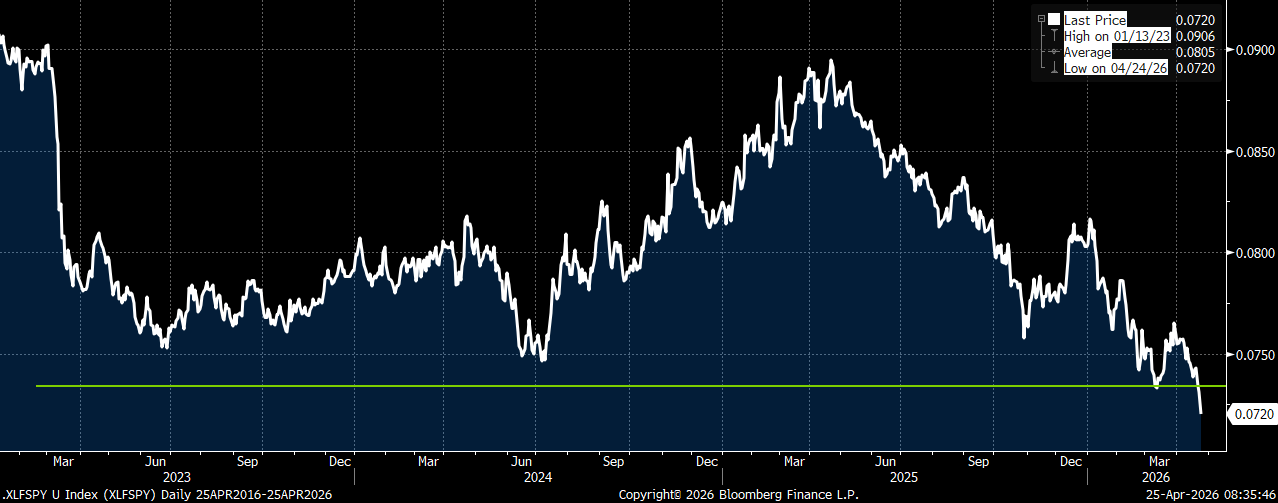
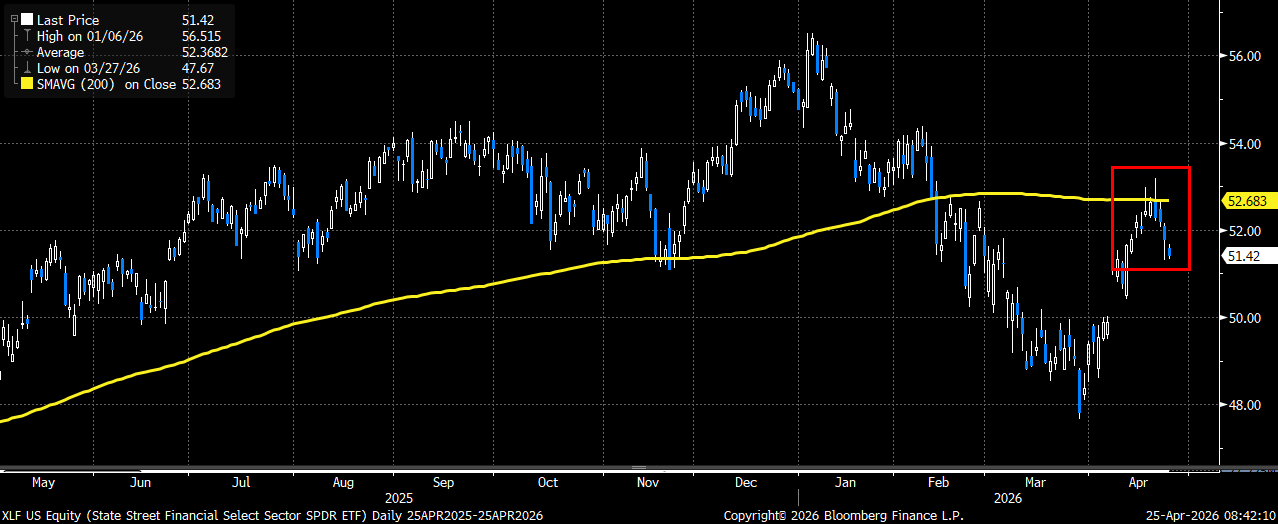
Keep in mind the large-cap financials (XLF) peaked versus the market on a relative basis back in April and led the market lower thru most of the March decline. That XLF/SPY relative spread just made a new low and is now at levels not seen since right after COVID. Yes, some of the underperformance is due to the exceptional strength by the technology sector of the market, but let’s not forget that XLF peaked in January and had been declining well before the market moved lower in March. In addition, while SPY, QQQ and IWM all have made new highs on this latest rally, XLF was only able to rally back to ~ 7% below its Jan high and was also unable to close above its 200-day moving average. Whether it is lingering concerns about private credit, or the flattening yield curve, large caps financials continue to trade rather poorly (especially given how strong the tape has been).
XLF/SPY relative spread just made a new relative low and is now back to trading at levels not seen since right after COVID
The inability for XLF to reclaim the 200-day, while the overall market continues to hit new highs, is also very concerning
I suggest adding low-cost XLF June put spread hedges now that 40-delta put implied vol has dropped from 27 to 19 and with put skew still attractive. Here is a hedge trade I would consider at this time:
Buy XLF June 18th 51 puts
Sell XLF June 18th 45 puts
Costs ~ $0.95 (XLF 51.42 Fri close ref)
Trade Details:
- Buying the 2-month (June) XLF put spread following rally off the lows, and continued underperformance to the overall market
- Put spread starts less than 1% below spot, and offers an attractive 5.3x to 1 max payoff at expiration
- Selling the 45 put covers nearly 20% of the cost of buying the 51 puts (selling 27 vol/buying 19 vol)
- Please reach out to me or the 22V sales team for updated pricing and execution capabilities
The other bank ETF hedge I want to focus on are the regional banks (KRE). They also had a very sharp rally off their March lows, gaining as much as 15%, and have since stalled out a bit. What is also a bit of a concern is that even on the sharp rally since March, they also remain well below the highs established back in Feb. Besides that, there are other reasons why I believe KRE hedges look very attractive at this time:
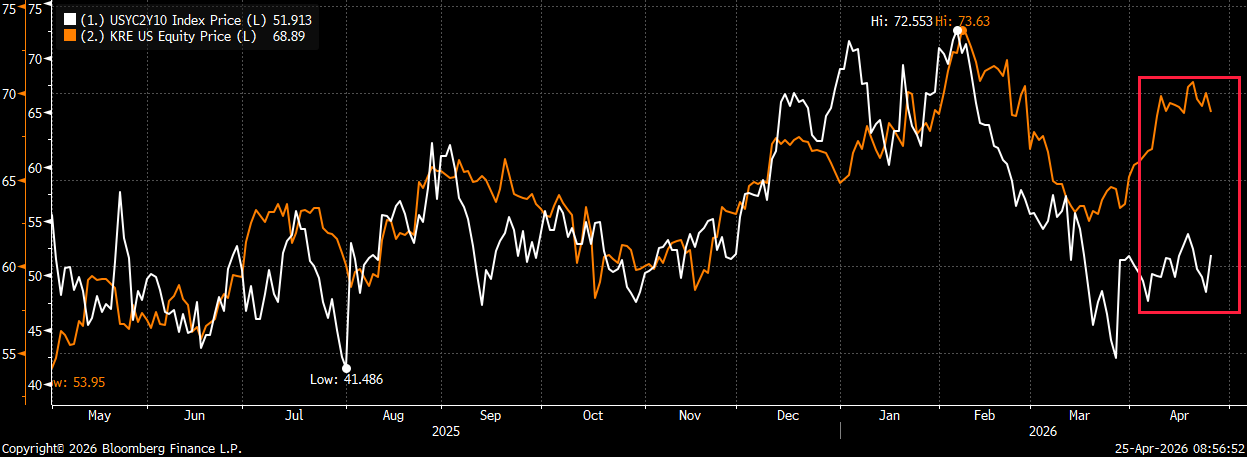
1) KRE has dislocated from the 2/10 treasury spread
KRE has tracked the 2/10 spread VERY well for the better part of a year. Since mid-March we have seen KRE move back higher, yet the 2/10 spread remains near the lows. Given the typical relationship we have seen, I believe KRE is at risk of playing “catch-up” to where the current spread is trading
Have seen KRE dislocate severely from where the current 2/10 spread trades
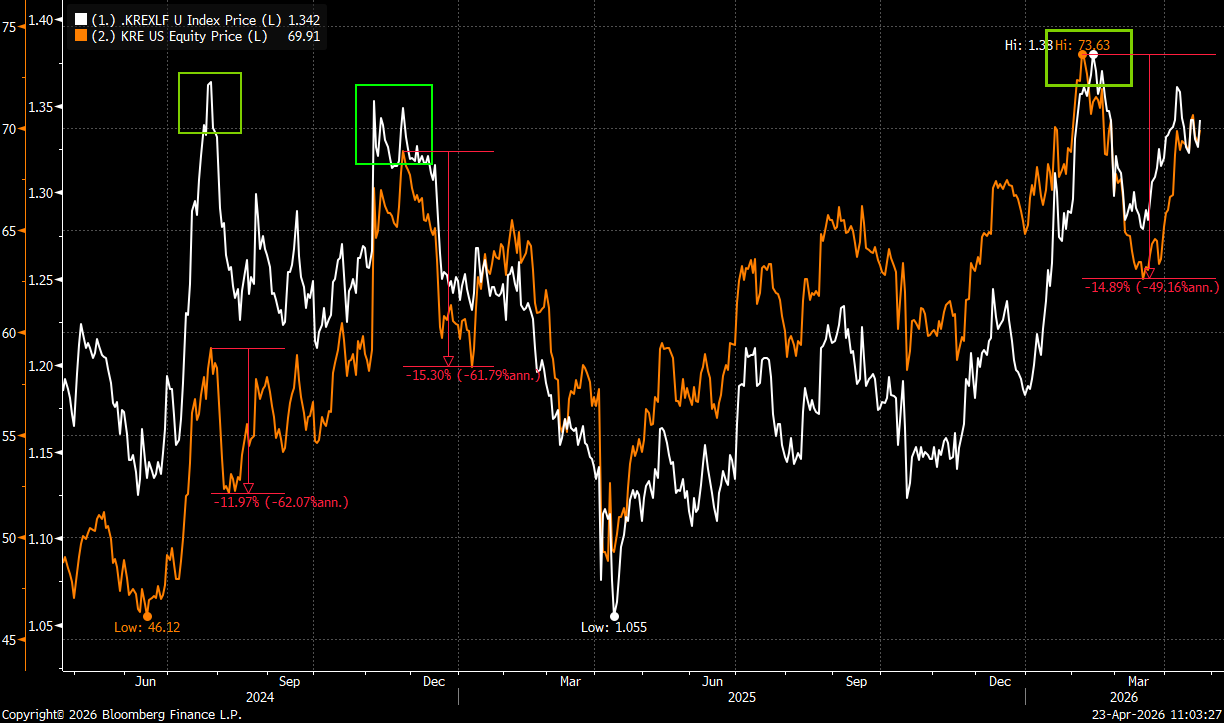
2) KRE/XLF spread back near the 2-year highs
The last 3x the KRE/XLF relative spread was at/near these levels, we saw the spread move lower and was led by KRE weakness
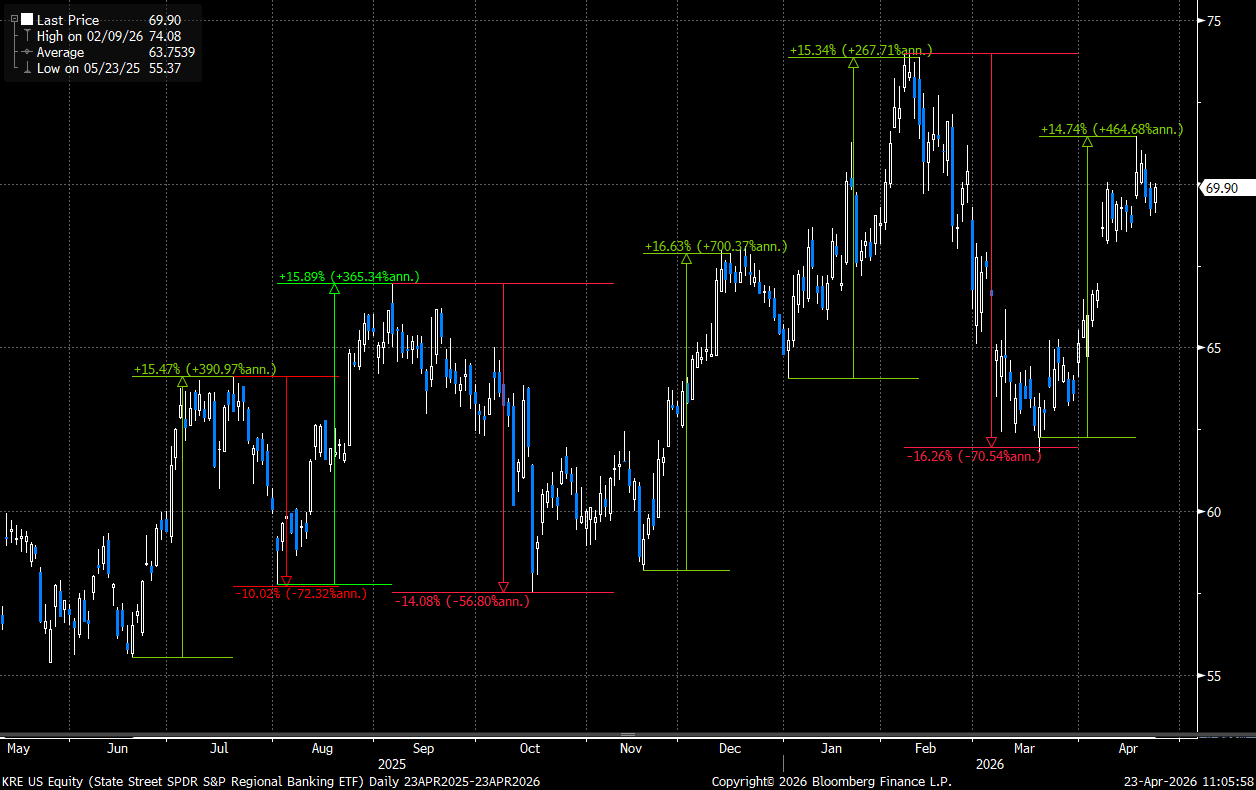
3) KRE has been a VERY volatile sector with EIGHT moves of 10% or more just since last June (5 higher and 3 lower)
You want to pick spots after rallies (like now) to tactically add “cheap” hedges given the realized moves over the past year
Here is a KRE hedge trade I favor adding at this time:
Buy KRE June 18th 67 puts
Sell KRE June 18th 59 puts
Costs ~ $1.50 (KRE 68.89 Fri close ref)
Trade Details:
- Buying the June put spread in KRE following sharp rally off the March lows
- Divergence to 2/10 spread, as well as outperformance to large-cap financials (XLF) are two reasons I favor the trade at this time
- Put spread starts less than 3% lower, and offers a 4.3x to 1 max payoff on the hedge that has nearly 2-months of duration
- KRE has had 8 moves of 10%+ since last June – this is a vol you want to own after a big move (higher or lower)
- KRE 2-month 40-delta put vol has moved down sharply as market and sector have rallied
- Trade can be initiated as a hedge if long/overweight the sector, or as a limited-risk bearish bet given favorable setup
- Please reach out to me or the 22V sales team for updated pricing and execution capabilities

