Back Derivatives Strategy

VIX Back to “Must Own” levels and Why Energy Sector Calls Look Very Compelling

Published on April 19, 2026

∙ Download the PDF Report

By

Jeff Jacobson

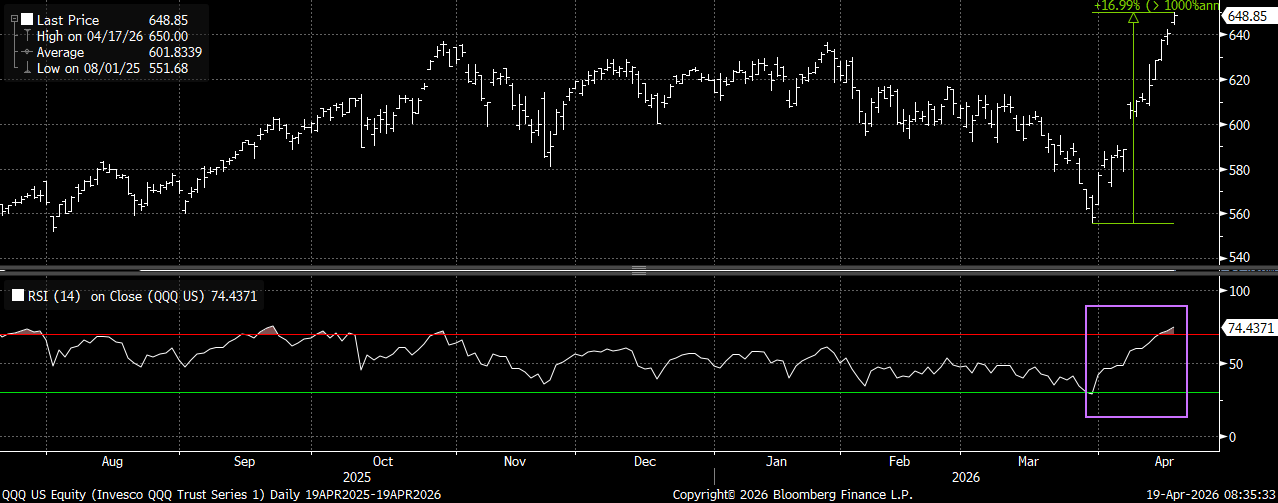
Equity markets saw their huge upside momentum continue last week, with Nasdaq + 6.25%, SPX +4.5% and small caps + 5.5% . Continued optimism of a peace agreement in the Middle East helped propel the markets higher for a third straight week. To put this rally into context, the relative strength index (RSI) for the tech-heavy Nasdaq (QQQ) moved from “oversold” to “overbought” in just over 2 weeks, moving the index from a 7-month low to an all-time high at the same time.

QQQ with a 17% rally off the March lows. We also saw the RSI go from the most oversold to most overbought in just over two weeks
A screen shot of a graph

AI-generated content may be incorrect.

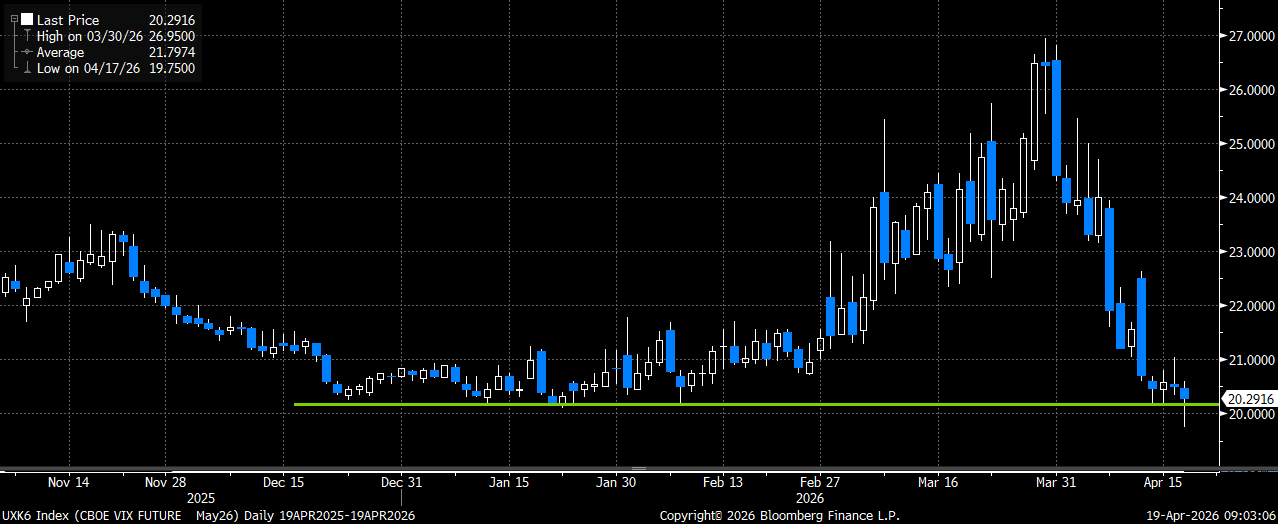
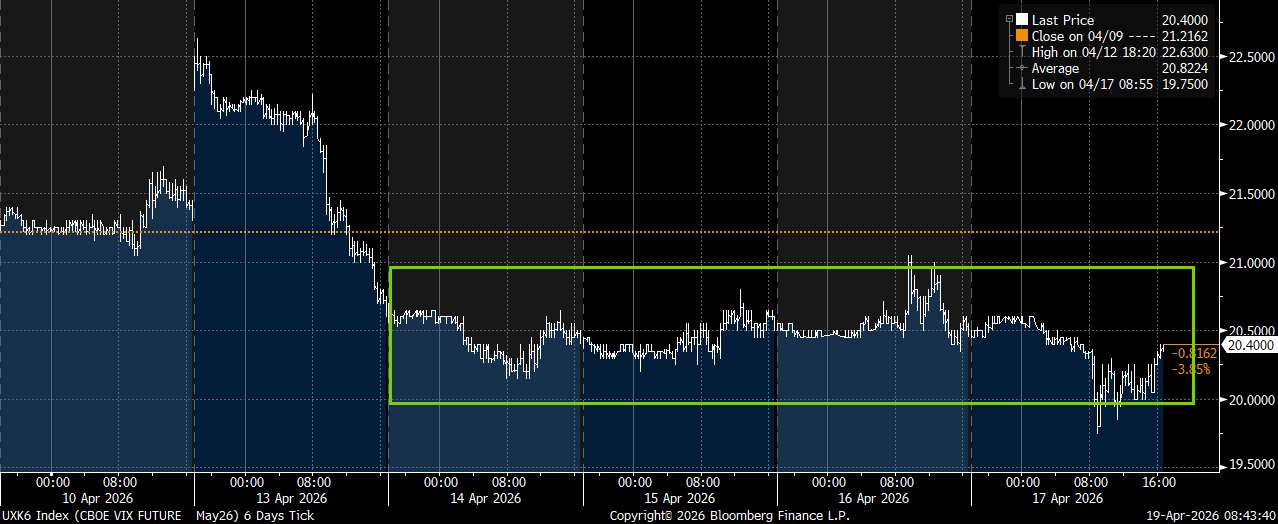
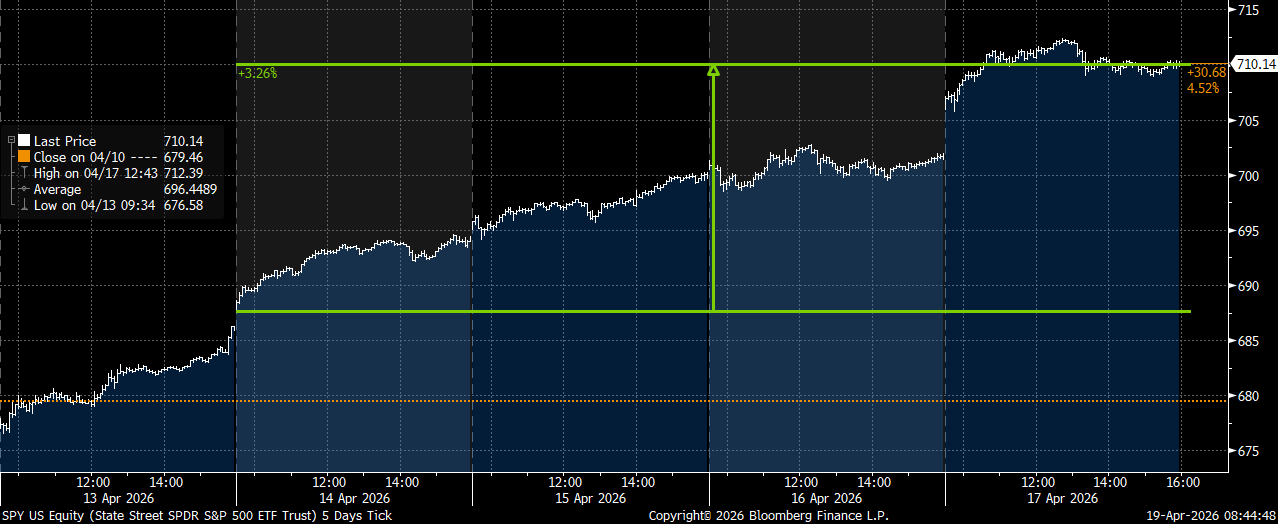
While the indices have continued to march higher, I started closely watching the front-month (May) VIX futures last week to see how volatility was behaving. What I noticed was that even though markets continued to rally on a daily basis, making new highs, May VIX futures were essentially flat from Tuesday morning thru the Friday close. To me, this is a very important distinction since vol was telling us (for now) that there could be a quasi-floor at current levels. The SPX (SPY) gained 3.25% from the Tuesday morning open to the close on Friday, yet VIX futures were basically flat.

May VIX futures dropped from 27 to 20 as market rallied, but have been unable to close at new contract lows
A graph with lines and numbers

AI-generated content may be incorrect.

May VIX futures were basically flat from the Tuesday open thru Friday close
A graph with lines and dots

AI-generated content may be incorrect.

SPY gained 3.25% from the Tuesday open thru the Friday close
A graph with a line in the middle

AI-generated content may be incorrect.

If VIX is unable to move meaningfully lower, even as markets continue to rocket higher, it makes owning VIX calls/call spreads an especially attractive proposition as a macro hedge. For example, the VIX May 19th 25 calls traded ~ $1.20 – $1.25 on the Tuesday open and closed the week worth ~ $1.12 (for a 4-day loss of less than 10% on the hedge). A comparable SPY May 15th 30-delta put bought on Tuesday would have lost more than HALF it’s value over the same 4 days (and the delta went from 30 to 15). The recent action in VIX, coupled with the massive gains we have seen in just the past few weeks, makes VIX upside May structures a “must own” in my opinion. With the negative weekend headlines on Iran I suspect that VIX is likely to open higher on Monday, but I would still look to tactically add upside May call spreads, especially if/when we see the market rally (and VIX move lower).

Trade
Buy May 19th VIX 23 calls
Sell May 19th VIX 45 calls
Costs ~ $1 (May futures ref of 20.29 – Fri close)

Trade Details:

  • Buying the May VIX call spread as a macro portfolio hedge following sharp equity rally and decline in volatility
  • VIX has been unable to make new contract lows, even as market has continued higher the past four days
  • Trade offers a better than 20x to 1 max payout on the limited-risk bet/hedge
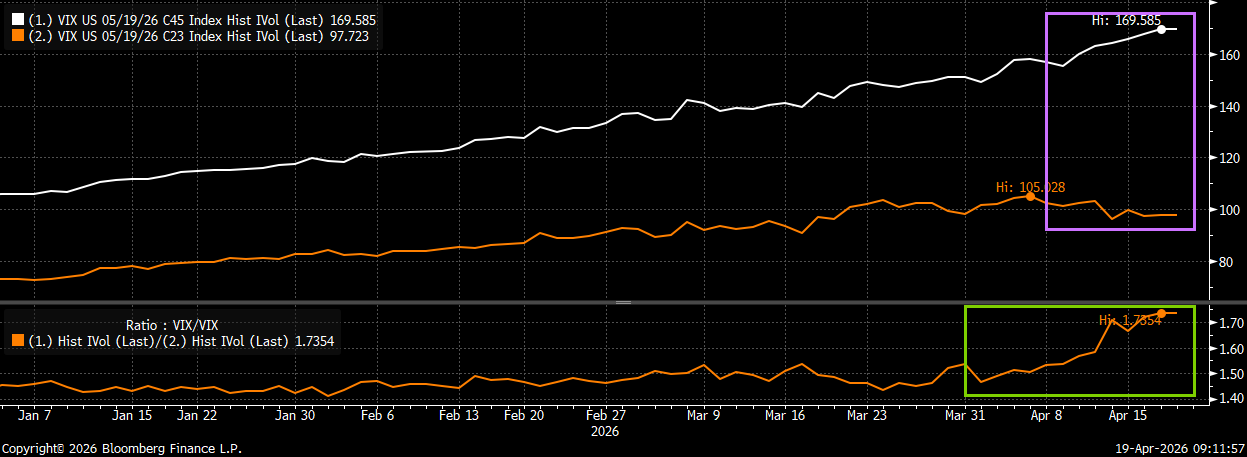
  • Call skew is VERY attractive with the tail calls (45 strike) trading at a huge vol skew to the closer to the money 23 strike calls (selling 170 vol to buy vol ~ 100)
  • Selling the 45 calls covers 25% of the cost of the higher delta 23 calls
  • Trade has 30 days until expiration (consider where volatility and markets were just 20 days ago)
  • Please reach out to me or the 22V sales team for updated pricing and execution capabilities

Upside call vol continues to move higher as the closer to the money call vol has come in. Call skew now at the highs and favorable
A graph of a graph with lines and numbers

AI-generated content may be incorrect.

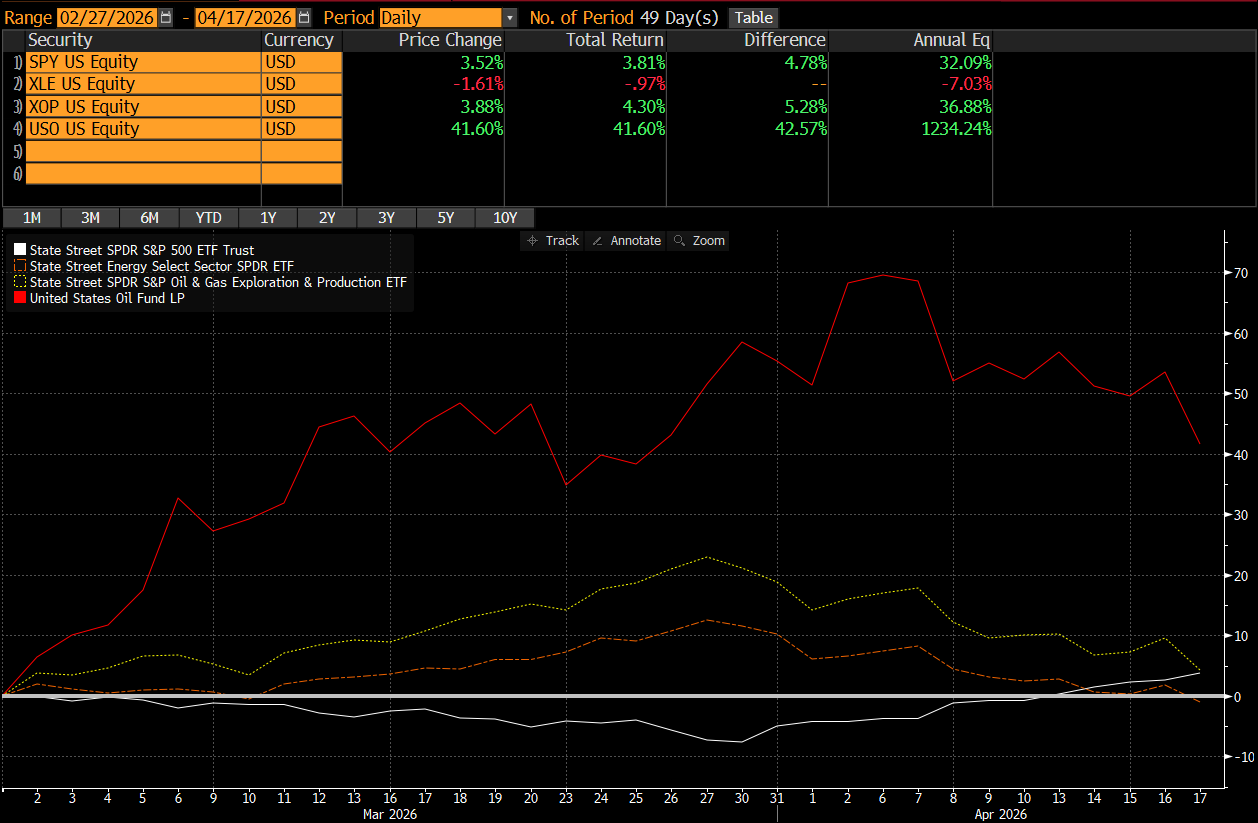
Energy sector ETFs have lagged even with oil considerably higher

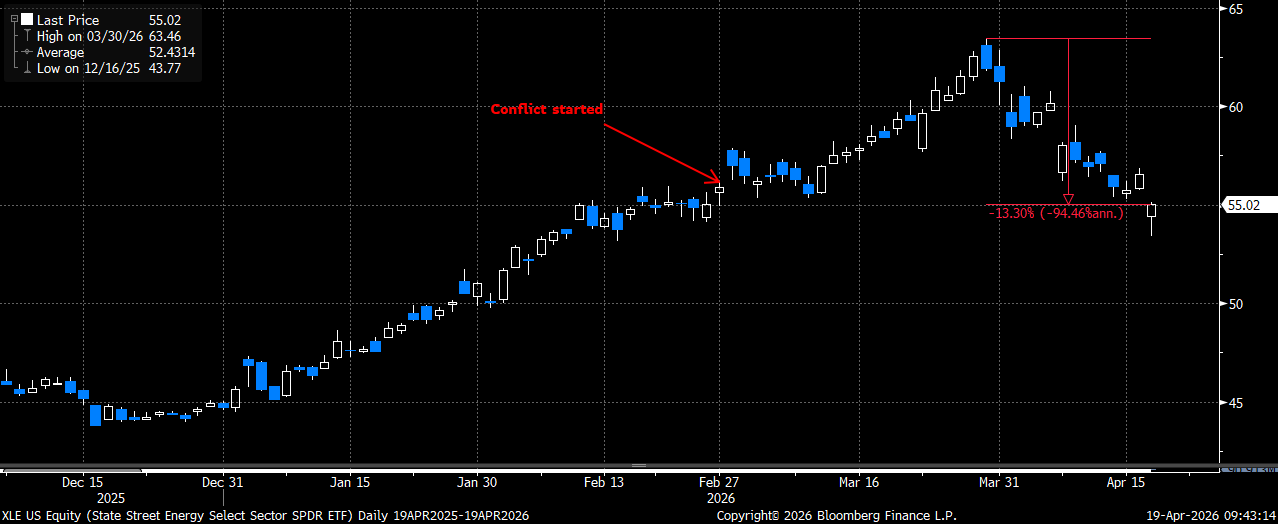
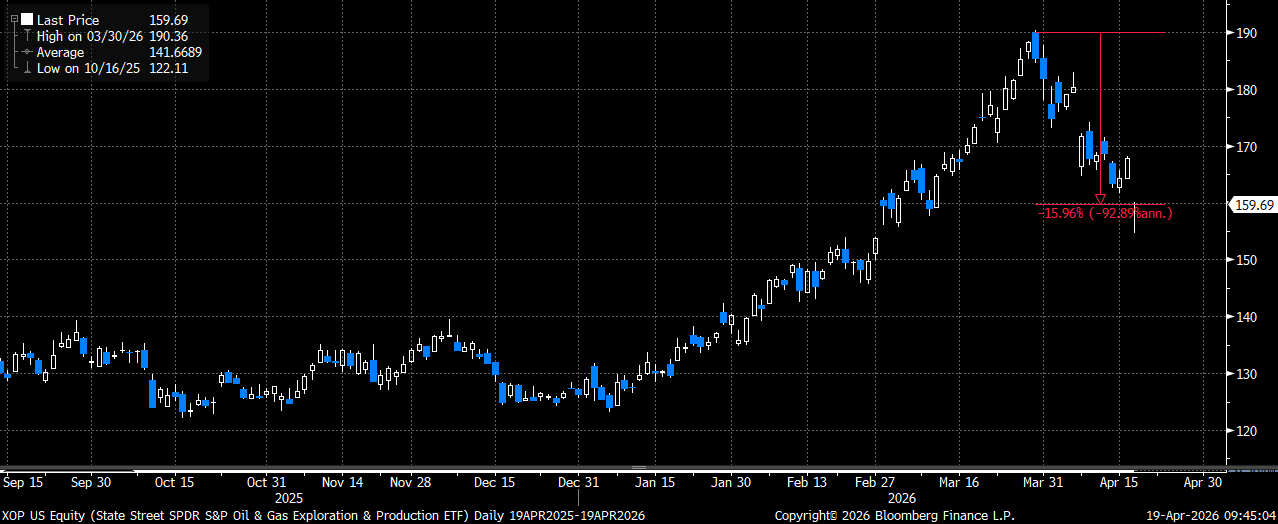
While the markets have made new highs, the main energy ETFs (XLE and XOP) have performed very poorly. Oil is still UP over 40% since the start of the war with Iran, yet XLE is DOWN 1% over that time and XOP is essentially up the same 4% the SPX is over that same time. I get that perhaps markets have been discounting lower oil from here (assuming we actually get a peace resolution), but the fact that XLE is down since BEFORE the conflict started probably will surprise you. Both XLE and XOP are down ~ 13 to 16% from their highs, and I believe both look interesting in terms of adding upside exposure.
A screen shot of a computer

AI-generated content may be incorrect.

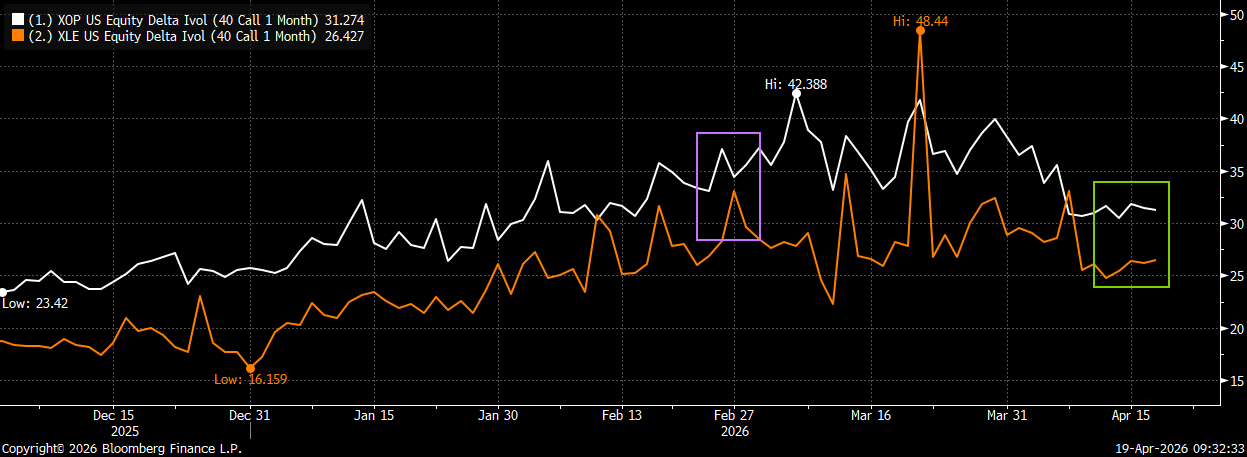
What I also find very interesting is that upside call volatility for both XLE and XOP is now LOWER than before the conflict as well. Looking at the 40-delta May calls for both, XOP call vol is down ~ 3 points since the end of Feb, while XLE call vol is down ~ 6-7 points. I believe this combination of pullback from the highs, decrease in upside call volatility and underperformance to overall market makes buying upside May calls a compelling proposition. Much like with VIX, I would expect that given the weekend headlines that oil is likely to be higher on the Monday open, but I would use any pullback in oil to add XLE and/or XOP upside May calls.

1-month (May) 40-delta call vol for XLE and XOP are both lower than they were before the war started
A graph with orange and white lines

AI-generated content may be incorrect.

Two trades I suggest:

Buy XOP May 15th 165 calls for ~ $3.75 (XOP 159.59 Fri close ref)

Buy XLE May 15th 56 calls for ~ $1.25 (XLE 55.02 Fri close ref)

Trade Details:

  • Buying the 1-month 40-delta calls in either of the main energy ETF’s following 13-16% pullback in both
  • Have seen implied vol move lower for both and they both now trade at CHEAPER vols than before the conflict started
  • XLE is actually lower than before the war started, even though oil remains ~ 40% higher
  • Defined-risk way to add exposure to the energy names following sharp pullback from the highs
  • May expiration also captures earnings for most of the larger energy names (another reason I favor the tactical call purchase)
  • Please reach out to me or the 22V sales team for updated pricing and execution capabilities

XLE down more than 13% from the highs and below the level it was trading at before the conflict started
A graph on a black background

AI-generated content may be incorrect.


XOP with a 16% decline from the highs as well
A graph with blue and white lines

AI-generated content may be incorrect.

DISCLOSURES AND DISCLAIMERS

Analyst Certification

The analyst, 22V Research Group, primarily responsible for the preparation of this research report attests to the following: (1) that the views and opinions rendered in this research report reflect his or her personal views about the subject companies or issuers; and (2) that no part of the research analyst’s compensation was, is, or will be directly related to the specific recommendations or views in this research report.

Analyst Certifications and Independence of Research.

Each of the 22V Research analysts whose names appear on the front page of this report hereby certify that all the views expressed in this Report accurately reflect our personal views about any and all of the subject securities or issuers and that no part of our compensation was, is, or will be, directly or indirectly, related to the specific recommendations or views of in this Report.

22V Research (the “Company”) is an independent research provider. The Company is not a member of the FINRA or the SIPC and is not a registered broker dealer or investment adviser. 22V Research has no other regulated or unregulated business activities which conflict with its provision of independent research.

22V Research, LLC is a professional services and independent publication organization. 22V Research, LLC is not a securities broker-dealer, not a member of the Financial Industry Regulatory Authority (FINRA), not a registered investment advisor (RIA) and not a member of SIPC.

Securities transactions, when offered, are offered by 22V Securities, LLC through LPS Capital, LLC. Certain employees of 22V Securities, LLC are dually registered as securities representatives of LPS Capital, LLC or Analyst Hub Securities, LLC. 22V Securities, LPS Capital and Analyst Hub Securities are members FINRA, SIPC.

https://brokercheck.finra.org/

Current Ratings Definition.

SECTOR OUTPERFORM: An “outperform” rating anticipates the company will outperform the S&P Regional Banking Index (peer group).

SECTOR PERFORM: A “market perform” rating anticipates the company will perform in line with the S&P Regional Banking Index (peer group).

SECTOR UNDERPERFORM: An “underperform” rating anticipates the company will underperform the S&P Regional Banking Index (peer group).

Limitation Of Research And Information.

This Report has been prepared for distribution to only qualified institutional or professional clients of 22V Research Group. The contents of this Report represent the views, opinions, and analyses of its authors. The information contained herein does not constitute financial, legal, tax or any other advice. All third-party data presented herein were obtained from publicly available sources which are believed to be reliable; however, the Company makes no warranty, express or implied, concerning the accuracy or completeness of such information. In no event shall the Company be responsible or liable for the correctness of, or update to, any such material or for any damage or lost opportunities resulting from use of this data. Nothing contained in this Report or any distribution by the Company should be construed as any offer to sell, or any solicitation of an offer to buy, any security or investment. Any research or other material received should not be construed as individualized investment advice. Investment decisions should be made as part of an overall portfolio strategy and you should consult with a professional financial advisor, legal and tax advisor prior to making any investment decision. 22V Research Group shall not be liable for any direct or indirect, incidental or consequential loss or damage (including loss of profits, revenue or goodwill) arising from any investment decisions based on information or research obtained from 22V Research Group.

Reproduction And Distribution Strictly Prohibited.

No user of this Report may reproduce, modify, copy, distribute, sell, resell, transmit, transfer, license, assign or publish the Report itself or any information contained therein. Notwithstanding the foregoing, clients with access to working models are permitted to alter or modify the information contained therein, provided that it is solely for such client’s own use. This Report is not intended to be available or distributed for any purpose that would be deemed unlawful or otherwise prohibited by any local, state, national or international laws or regulations or would otherwise subject the Company to registration or regulation of any kind within such jurisdiction.

Copyrights, Trademarks, Intellectual Property.

22V Research Group, and any logos or marks included in this Report are proprietary materials. The use of such terms and logos and marks without the express written consent of 22V Research Group is strictly prohibited. The copyright in the pages or in the screens of the Report, and in the information and material therein, is proprietary material owned by 22V Research Group unless otherwise indicated. The unauthorized use of any material on this Report may violate numerous statutes, regulations and laws, including, but not limited to, copyright, trademark, trade secret or patent laws.
