Back Quantitative

Quant Market in Numbers: Index Revision Still Low – Software and Banks Present Opportunities

Published on April 19, 2026

Download the PDF Report

By

Dennis DeBusschere

Brian Herlihy

Sophia Wang

Kevin Brocks

Summary:  As we noted previously (HERE), companies set conservative 2Q targets amid heightened economic uncertainty. Now, two weeks into 1Q26 earnings season, Wall Street analysts’ earnings revisions are following suit — NTM EPS revisions have flattened and are tracking at a slower pace relative to history. However, two areas stand out as potential opportunities: Banks are delivering strong EPS beats, and the rebound in Software stocks has outpaced the pace of analyst revisions, suggesting room for upward catch-up.

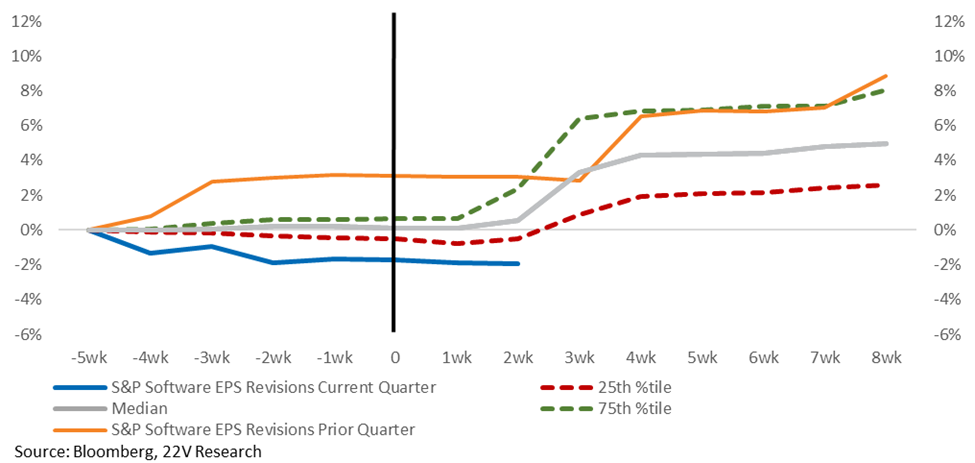
Since the end of January, analysts have been revising Software EPS estimates lower. Historically, around the middle of April (week 14) the percentage of analysts reducing estimates tends to decline. The prior year period followed a similar pattern. This suggests an opportunity: Wall Street analysts have kept Software estimates conservative and may need to catch up with EPS targets during this period of rapid price recovery.
A graph of different colored lines

AI-generated content may be incorrect.

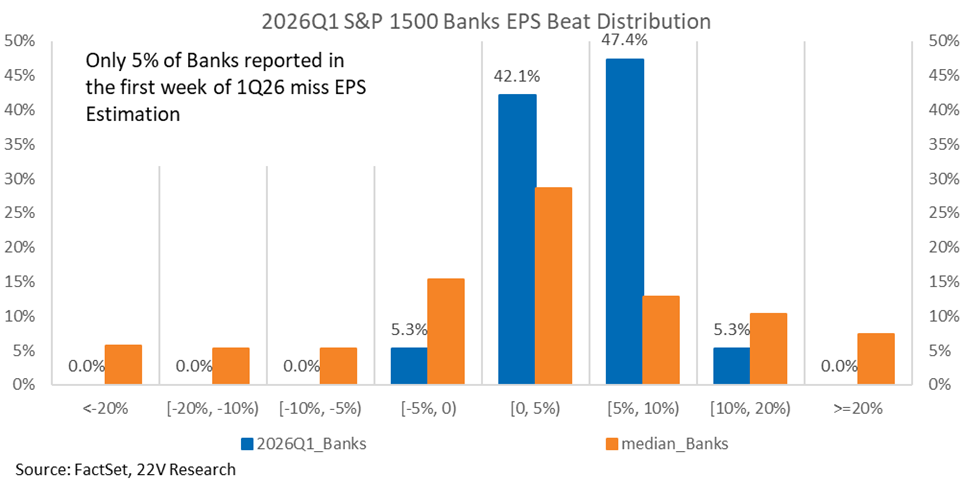
In the opening weeks of 1Q26, S&P 1500 Banks delivered strong EPS performance. Nearly 95% of reporting banks have beaten estimates and no bank missing by more than 5%. So far this quarter, there are no extreme beat or miss outliers. To play strategically for the winner in Banks, please refer to 22V Head of Financial Research Bill Hebel’s Banks 1Q Preview (HERE).

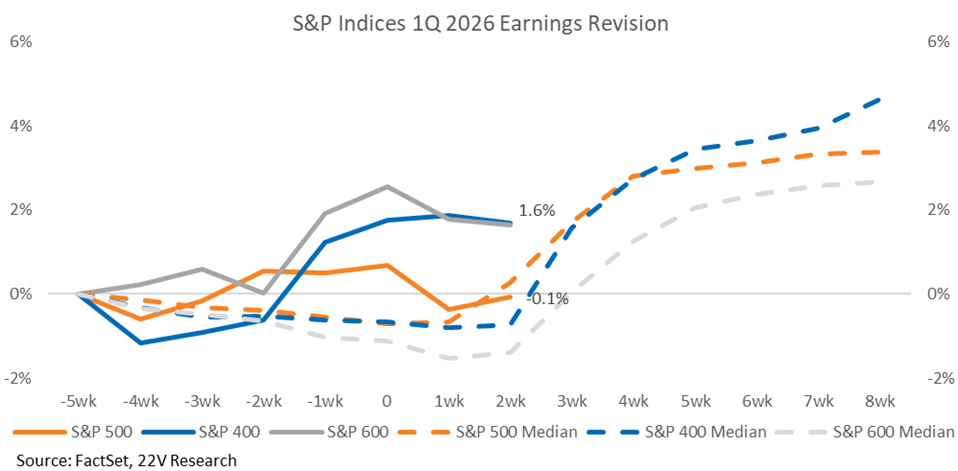
At the index level, the 2nd-3rd week of an earning season is an essential week for S&P 500 revisions. The number of companies reporting increases significantly, and the pace of revisions tends to climb rapidly. So far Wall Street estimates for the 500 have been conservative.

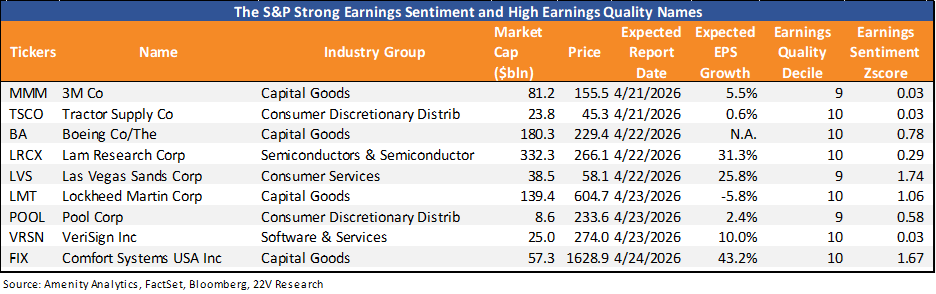
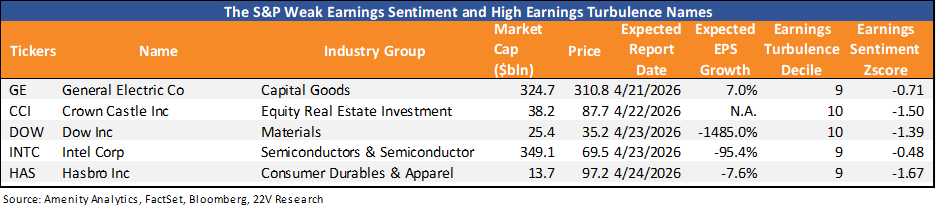
94 S&P 500 companies are going to report next week. At the end of this report, we highlight the names with the best quantitative beat potential and those with the largest risk of missing.

SOFTWARE: Since the end of January, analysts have been revising Software EPS estimates lower. As we discussed (HERE), Software names have been trading together to a very large degree and a popular recent theme is that compute scarcity means a slower pace of software displacement. Historically, around the middle of April (week 14) the percentage of analyst reducing estimates tends to decline. The prior year period followed a similar pattern. This suggests an opportunity: Wall Street analysts have remained conservative and may need to catch up with EPS targets during this period of rapid price recovery.
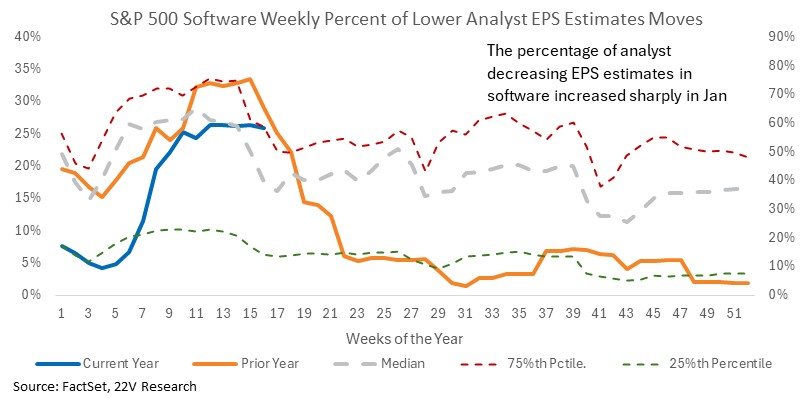
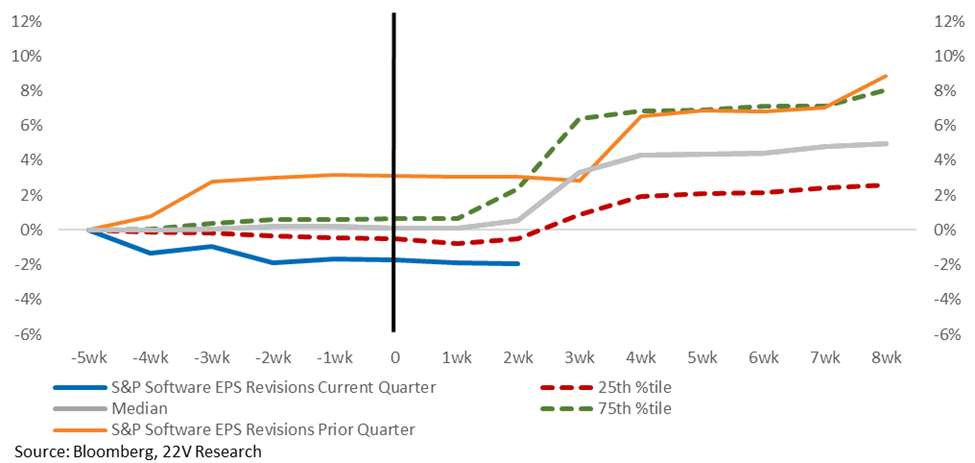
Current-quarter net EPS revisions for Software remain at a depressed level, well below the 25th percentile historically. This suggests analysts have yet to meaningfully adjust their views on Software earnings.
A graph of different colored lines

AI-generated content may be incorrect.


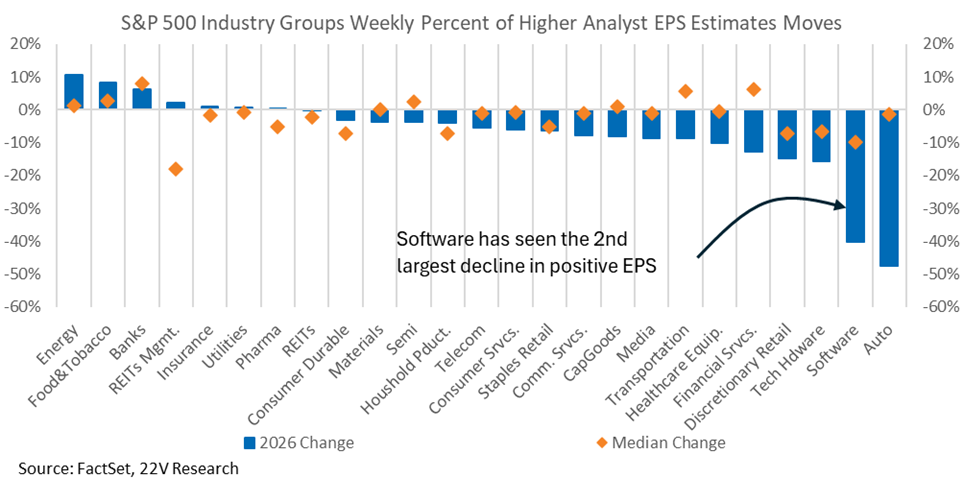
So far in the first 16 weeks of 2026, Software is the industry group with the 2nd lowest percentage of positive analyst revisions. Only Autos have seen a lower percentage of analysts raising EPS estimates. As we stated two months ago (HERE), the heightened risk within Software names and weakening analysts estimates led to a sell-off in the space. The long-term headwinds remain in place, but the setup ahead of earnings is still positive.
A graph of data on a white background

AI-generated content may be incorrect.


BANKS: In the opening weeks of 1Q26, S&P 1500 Banks delivered strong EPS performance. Nearly 95% of reporting banks have beaten estimates and no bank missing by more than 5%. So far this quarter, there are no extreme beat or miss outliers. To play strategically for the winner in Banks, please refer to 22V Head of Financial Research Bill Hebel’s Banks 1Q Preview (HERE).
 

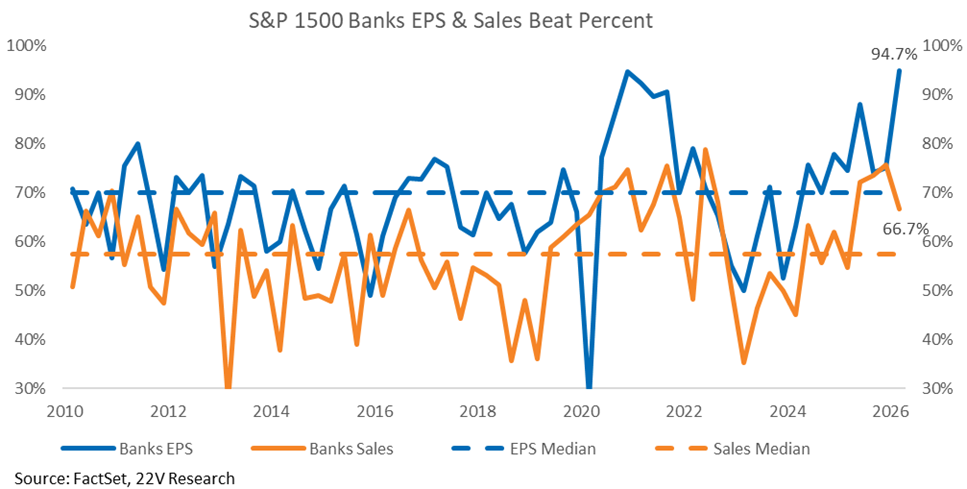
The 95% EPS beat rate for Banks is the highest level outside of the post-Covid recovery period, and both the EPS beat percentage and Sales beat rates sit well above their historical medians. While additional Banks report in the coming weeks may adjust these figures, performance is unlikely to move significantly below the median from here.
INDEX LEVEL: At the index level, steeping into the second week of the 1Q26 reporting revisions for all three indexes have flattened out. Small-Cap and Mid-Cap revisions are still well above their medians, while S&P 500 Earnings Revision are 1) in line and 2) have fallen in the 2nd week. Historically, the 2nd-3rd week of an earning season is an essential week for S&P 500 revisions. The number of companies reporting increases significantly, and the pace of revisions tends to climb rapidly. So far Wall Street estimates for the 500 have been conservative.
 

A graph of a graph showing the numbers and the same graph

AI-generated content may be incorrect.

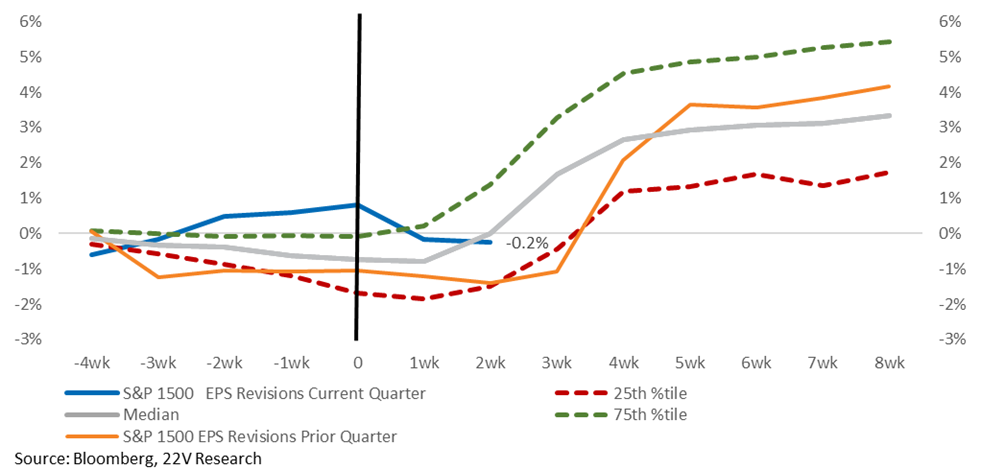
Compared with the prior quarter (4Q25), current EPS revisions are still leading on a cumulative basis. However, 4Q25 followed a different path: revisions ticked up beginning in the third week of earnings season and ultimately finished above the historical median. It is still too early to draw conclusions about how this season will end, but the first-week decline signals that Wall Street analysts entered the season with less conviction than they held in the weeks prior.
A graph of different colored lines

AI-generated content may be incorrect.

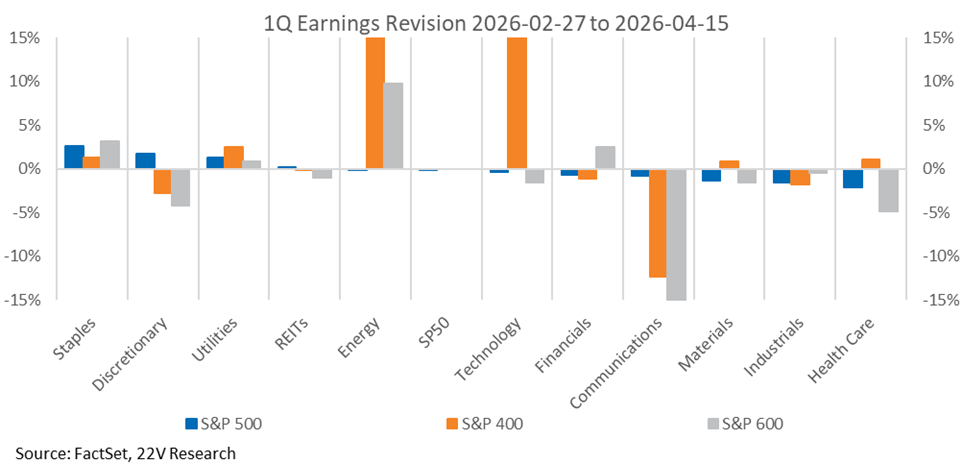
Across the three universes, the S&P 500 exhibits the mildest earnings revision dispersion — all sector revisions fall within a +5% to -5% range. Mid-caps and small-caps, by contrast, show more extreme sector-level moves, particularly in Energy and Comms. For example, SNX single-handedly drove a +44% upward revision in mid-cap Technology, and Tidewater (TDW) accounted for a +470% upward revision in small-cap Energy. Revisions of this magnitude are far less likely to occur within the S&P 500.
A graph of numbers and a number of numbers

AI-generated content may be incorrect.


WEEK AHEAD: 94 S&P 500 companies are going to report next week. Below we list the names with high Earnings Quality Score with positive earnings sentiment, which used to have higher potential to beat.A screenshot of a computer screen
AI-generated content may be incorrect.


And names with high Earnings Turbulence Score with negative sentiment score, which have a large miss rate.
DISCLOSURES AND DISCLAIMERS

Analyst Certification

The analyst, 22V Research Group, primarily responsible for the preparation of this research report attests to the following: (1) that the views and opinions rendered in this research report reflect his or her personal views about the subject companies or issuers; and (2) that no part of the research analyst’s compensation was, is, or will be directly related to the specific recommendations or views in this research report.

Analyst Certifications and Independence of Research.

Each of the 22V Research analysts whose names appear on the front page of this report hereby certify that all the views expressed in this Report accurately reflect our personal views about any and all of the subject securities or issuers and that no part of our compensation was, is, or will be, directly or indirectly, related to the specific recommendations or views of in this Report.

22V Research (the “Company”) is an independent research provider. The Company is not a member of the FINRA or the SIPC and is not a registered broker dealer or investment adviser. 22V Research has no other regulated or unregulated business activities which conflict with its provision of independent research.

22V Research, LLC is a professional services and independent publication organization. 22V Research, LLC is not a securities broker-dealer, not a member of the Financial Industry Regulatory Authority (FINRA), not a registered investment advisor (RIA) and not a member of SIPC.

Securities transactions, when offered, are offered by 22V Securities, LLC through LPS Capital, LLC. Certain employees of 22V Securities, LLC are dually registered as securities representatives of LPS Capital, LLC or Analyst Hub Securities, LLC. 22V Securities, LPS Capital and Analyst Hub Securities are members FINRA, SIPC.

https://brokercheck.finra.org/

Current Ratings Definition.

SECTOR OUTPERFORM: An “outperform” rating anticipates the company will outperform the S&P Regional Banking Index (peer group).

SECTOR PERFORM: A “market perform” rating anticipates the company will perform in line with the S&P Regional Banking Index (peer group).

SECTOR UNDERPERFORM: An “underperform” rating anticipates the company will underperform the S&P Regional Banking Index (peer group).

Limitation Of Research And Information.

This Report has been prepared for distribution to only qualified institutional or professional clients of 22V Research Group. The contents of this Report represent the views, opinions, and analyses of its authors. The information contained herein does not constitute financial, legal, tax or any other advice. All third-party data presented herein were obtained from publicly available sources which are believed to be reliable; however, the Company makes no warranty, express or implied, concerning the accuracy or completeness of such information. In no event shall the Company be responsible or liable for the correctness of, or update to, any such material or for any damage or lost opportunities resulting from use of this data. Nothing contained in this Report or any distribution by the Company should be construed as any offer to sell, or any solicitation of an offer to buy, any security or investment. Any research or other material received should not be construed as individualized investment advice. Investment decisions should be made as part of an overall portfolio strategy and you should consult with a professional financial advisor, legal and tax advisor prior to making any investment decision. 22V Research Group shall not be liable for any direct or indirect, incidental or consequential loss or damage (including loss of profits, revenue or goodwill) arising from any investment decisions based on information or research obtained from 22V Research Group.

Reproduction And Distribution Strictly Prohibited.

No user of this Report may reproduce, modify, copy, distribute, sell, resell, transmit, transfer, license, assign or publish the Report itself or any information contained therein. Notwithstanding the foregoing, clients with access to working models are permitted to alter or modify the information contained therein, provided that it is solely for such client’s own use. This Report is not intended to be available or distributed for any purpose that would be deemed unlawful or otherwise prohibited by any local, state, national or international laws or regulations or would otherwise subject the Company to registration or regulation of any kind within such jurisdiction.

Copyrights, Trademarks, Intellectual Property.

22V Research Group, and any logos or marks included in this Report are proprietary materials. The use of such terms and logos and marks without the express written consent of 22V Research Group is strictly prohibited. The copyright in the pages or in the screens of the Report, and in the information and material therein, is proprietary material owned by 22V Research Group unless otherwise indicated. The unauthorized use of any material on this Report may violate numerous statutes, regulations and laws, including, but not limited to, copyright, trademark, trade secret or patent laws.
