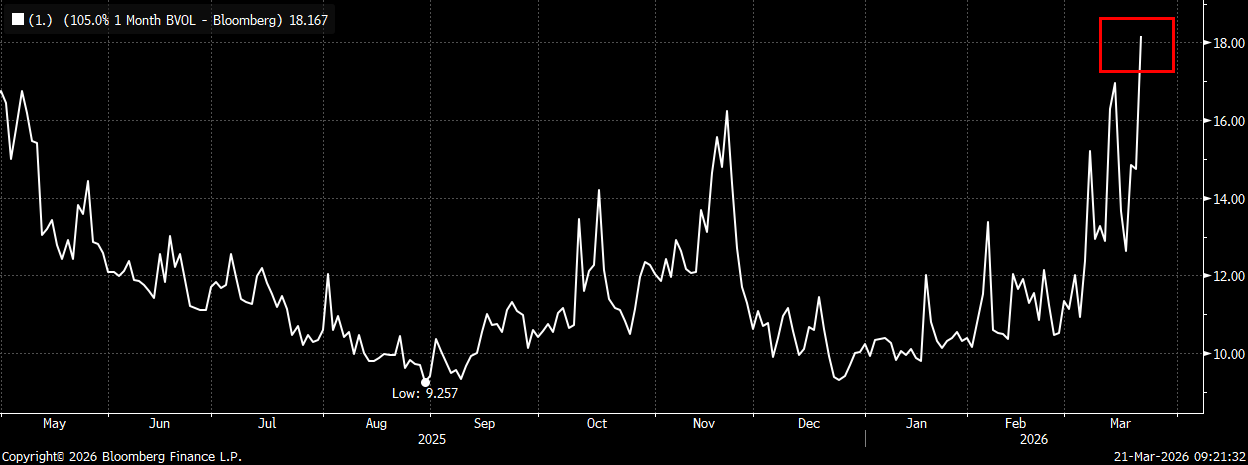
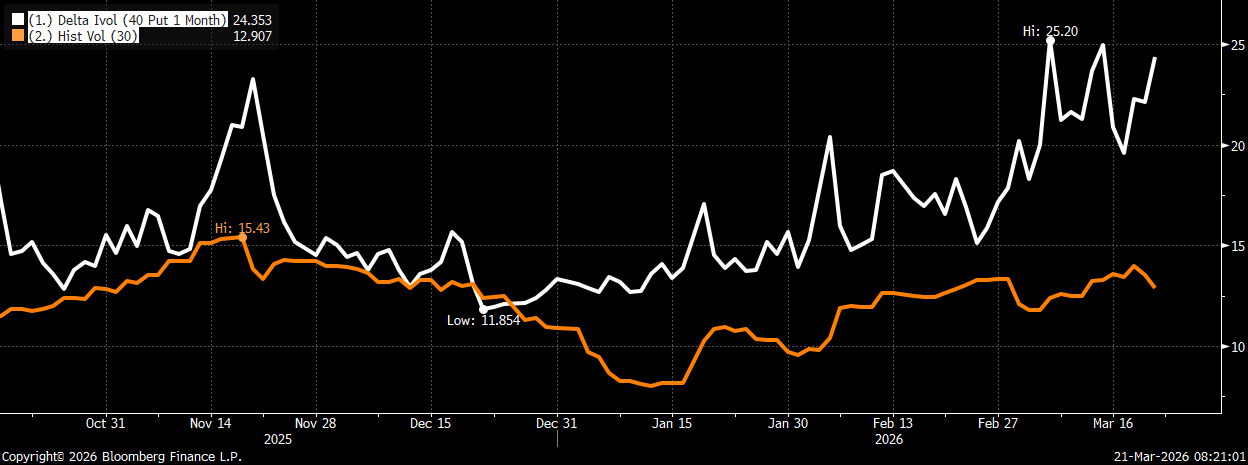
Last week was another messy one for the markets, with both the S&P (SPY) and Nasdaq (QQQ) down ~ 2% (with all the damage coming on Friday). Friday was the perfect storm of negative geopolitical headlines, coupled with a massive option expiration that likely added to the selling once dealer gamma came into play. Both indices are now down six of the past seven weeks, but with no weekly selloff being much more than about 2% for either. This has been the pattern now for the better part of two months, continued weakness but in a “controlled” fashion. Once again, implied volatility has remained very high even though both 30-day and 60-day implied volatility has continued to be rather subdued (especially when compared with where implied vol trades). This is exactly the reason why I have continued to stress owning downside hedge structures in both SPY and QQQ, but with a short vol bias (put spread collars, put butterflies, etc).
SPY 1-month 40-delta put vol remains near the highs, even though 30-day implied vol is low
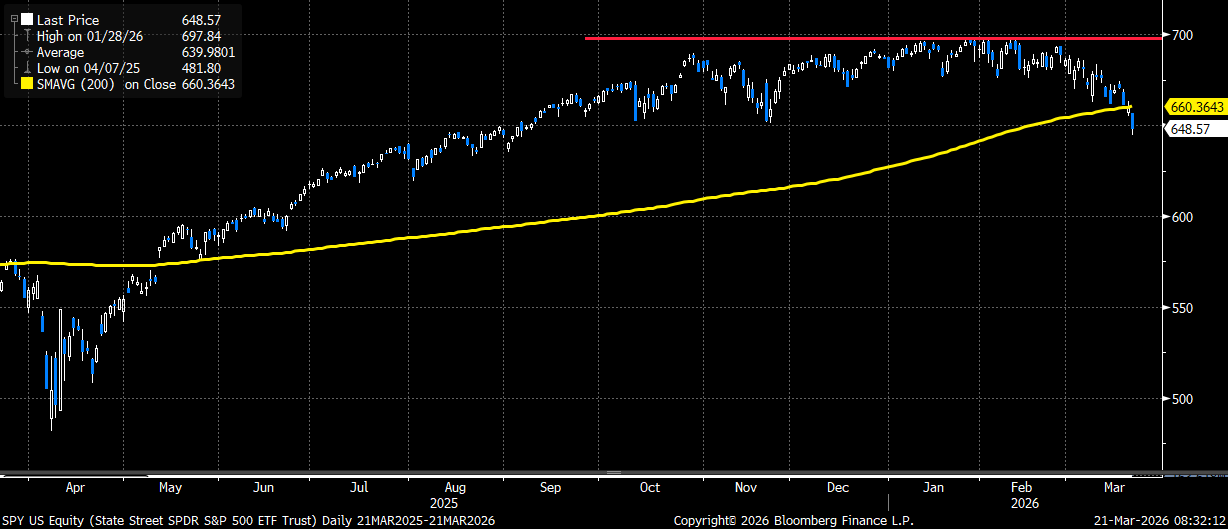
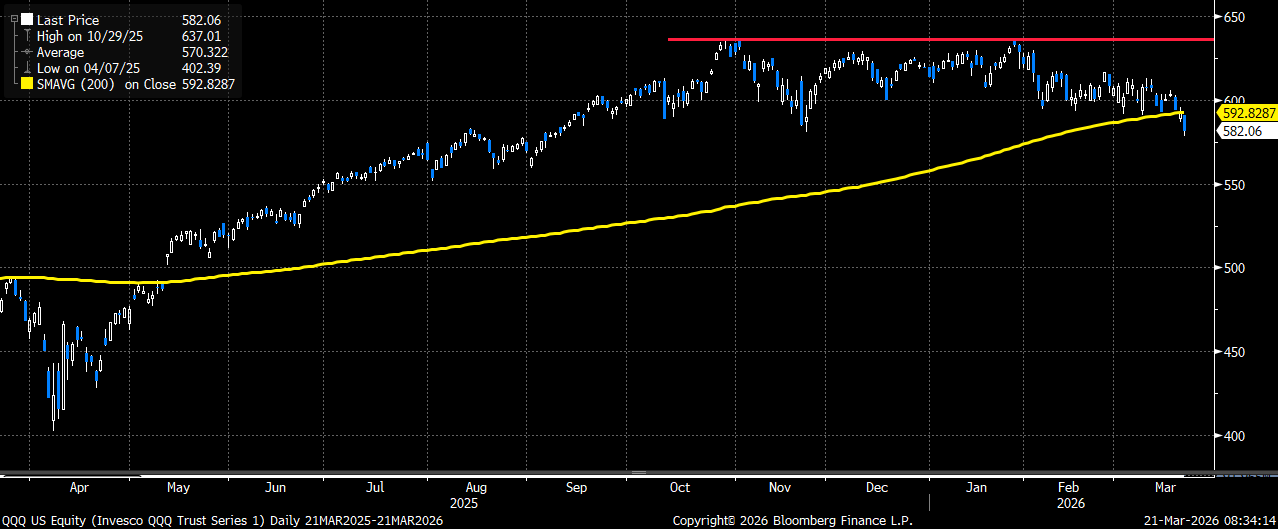
To put it mildly, the technical picture for the market looks terrible. SPY and QQQ both broke below the 200-day moving average this past week for the first time since May. While we could see an oversold bounce (SPY registered its lowest RSI reading since April on Friday), I am not in the camp that the market will ricochet back to the highs anytime soon given all the headwinds it continues to face. Therefore, on any “decent’ bounces/rallies I would absolutely look to establish new or additional hedges as it seems we can continue this “grind” lower in the major averages for a while.
SPY with a clear break below the rising 200-day moving average for the first time since last May
QQQ with a similar break below the 200-day
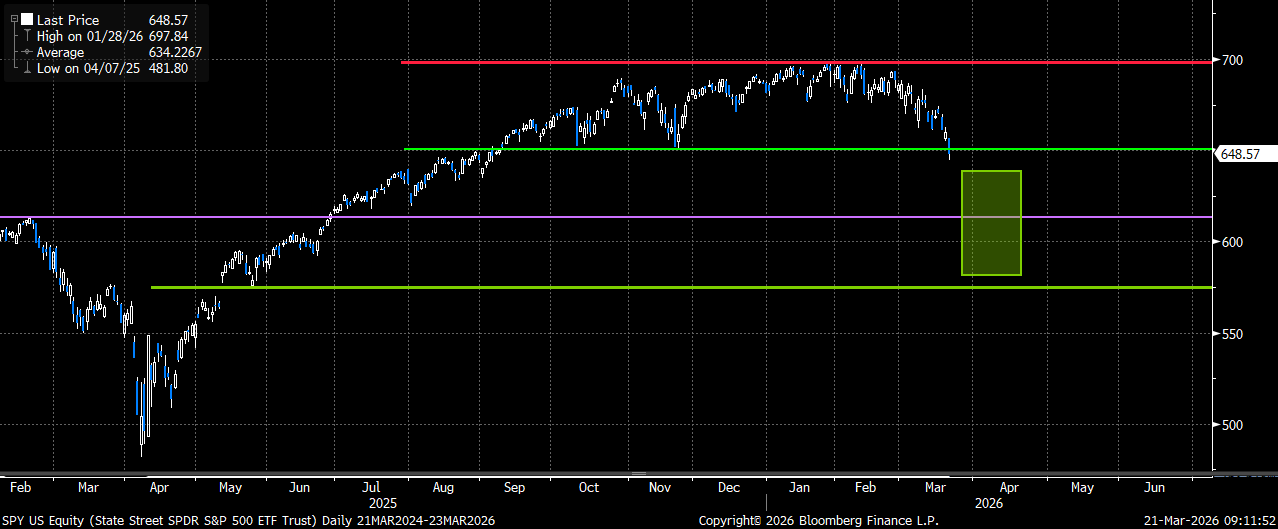
Speaking of technicals, about a month ago I thought SPY could break the first support area of 675, which would then target a move to the next support area of 650. To play for such a move I suggested buying the March 20th 675/650/625 put butterfly for $2.50 (here). With the sharp decline on Friday (day of expiry) to that 650 area (and below), the trade expired being worth approximately $22.15 for a nearly 9x return on the structure. Given the technical nature of the market, coupled with implied volatility remaining “rich” versus realized vol, I want to go back to the well with a new April put butterfly structure (but with a twist).
Trade:
Sell SPY April 17th 685 call
Buy SPY April 17th 640/610/580 put butterfly
Costs ~ $1.40 (based on Fri SPY close of $648.57)
Trade Details:
- Selling the nearly 6% upside calls (just below the highs), to buy the 30-point wide put butterfly that starts just over 1% lower
- Should SPY rally 1% from the Fri close, this structure would be closer to EVEN cost (would be a great time to establish)
- Trade is a great way to offset the elevated volatility, while still allowing for a 6% move back higher in a month
- Trade is short delta (27d) to start, with great carry (theta)
- To the downside, trade will be profitable between 638.60 and 581.40 by April 17th (-1.5% to -10.4%) with a max profit at 610 (6% lower)
- The 610 target is also just below the former highs from Feb ’25, which should be the next major area of technical support (why I chose that strike)
- This is not a ‘tail” hedge, but more of a higher probability downside structure. Keep in mind, the LARGEST monthly decline for SPY over the last three years was the 5.86% decline last March
- I like the upside call sale with the put butterfly purchase since I fully expect upside call vol to move meaningfully lower should we see a decent rally
- Low-cost overlay hedge trade with the potential for a high payout (like the March structure provided)
- Please reach out to me or the 22V sales team for updated pricing and execution capabilities
The GREEN areas shows where trade is profitable to the downside on expiration
1-month (April) 5% upside call vol at 10-month high and double from the lows