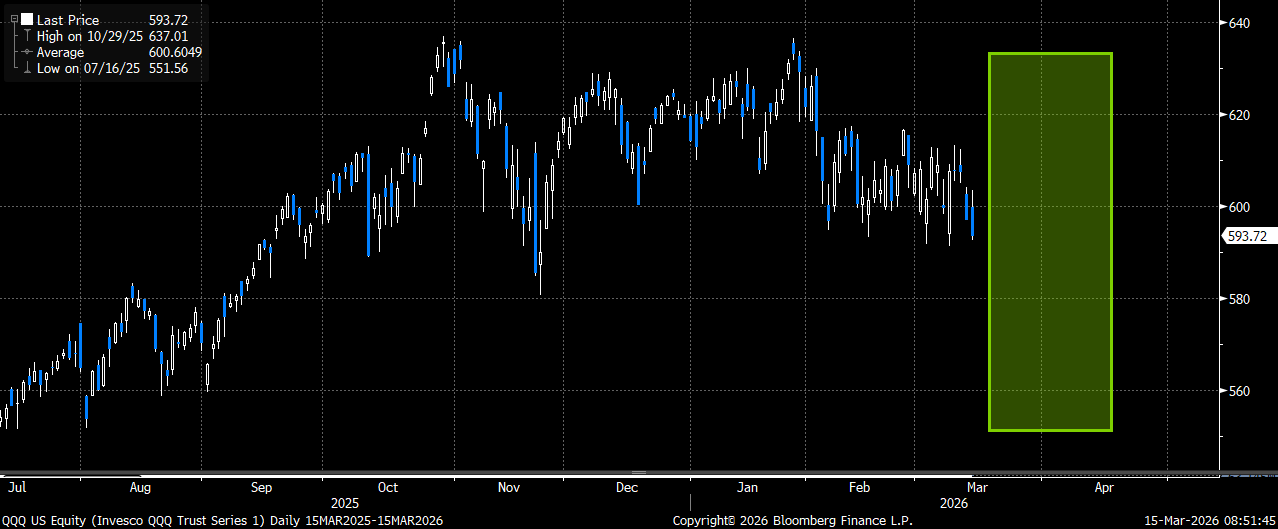
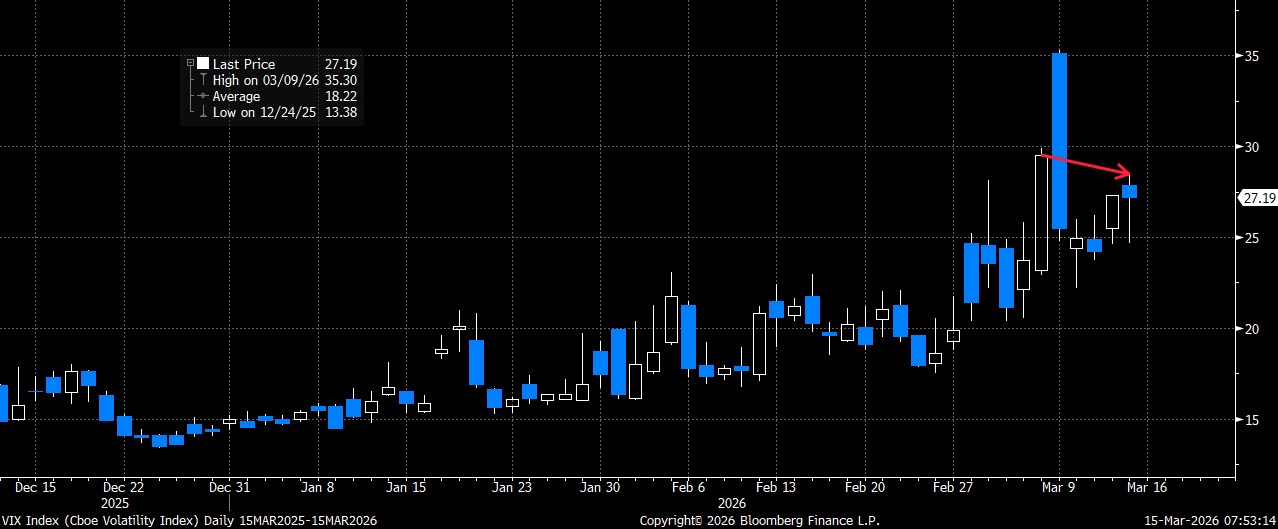
The action in the market last week was typical of what I have been speaking to in my last few notes. We saw weakness across the board, with tech (QQQ) down 1%, S&P (SPY) down 1.5% and small caps (IWM) down 1.71%. Volatility (VIX), however, was also down for the week after spiking to nearly 30 the week prior. Even though all three of the major indices closed down on the week, owning puts outright for March on any of the indices was likely either a losing proposition or perhaps a breakeven if you were lucky. Owning VIX calls outright was even worse than owning index puts as many of the March or April calls declined by 10-20% on the week as we saw spot VIX decline week over week.
The VIX index declined week over week, even as all three of the major indices dropped by 1% or more
The issue now for owning hedges outright is that even as the market continues to face several challenges between the situation in the Middle East, private credit, hyperscalers, etc volatility is NOT cheap. Looking at 1-month 40-delta SPY put implied volatility we see that not only has it climbed from a low of ~ 12 in December to a current 25, but it now also trades at a massive premium to 30-day realized volatility (which is currently ~ 13). Put another way if long these puts outright, and even if volatility stays constant, you need the market the decline by ~ 1% just to breakeven on those puts (the breakeven is higher for both QQQ and IWM given higher implied vols). Any move higher in the markets and you would “lose” two ways by just being long puts. First, you would have the delta move against you on the puts, and second, I would expect a decent vol decline on any rally given the large spread between current implied vol and realized vol. Even though SPY has now been down on 8 of the 11 weeks to start the year, only the previous two weeks were down moves greater than 1.28% (-1.5% and -1.98%). Again, you would need a move of > 1% just to start to breakeven by owning SPY 1-month (April) puts outright.
SPY 1-month (April) 40-delta put implied vol is now double where it traded in Dec and trades at a huge premium/spread to 30-day realized vol
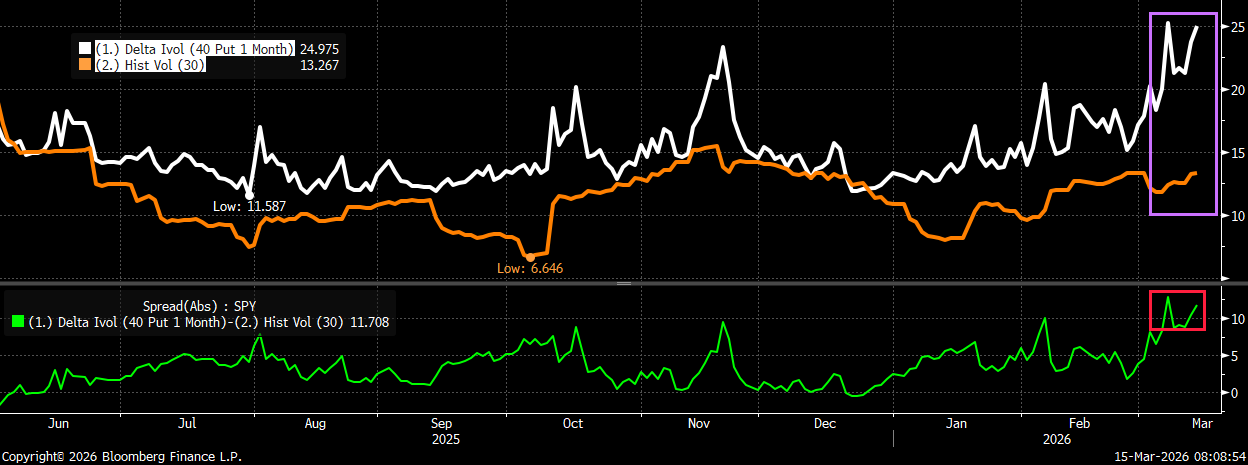
We typically have seen VIX at these levels only when the market has already moved down considerably more AND with realized moves being significantly higher than what we have seen thus far on the index level. Yes, perhaps we start to see realized moves start to catch-up to what current implied vol is signaling but given everything that has already been thrown at this market perhaps that just isn’t the case. A continued grind lower in the market would absolutely work against owning outright hedges (especially with volatility remaining at these lofty levels).
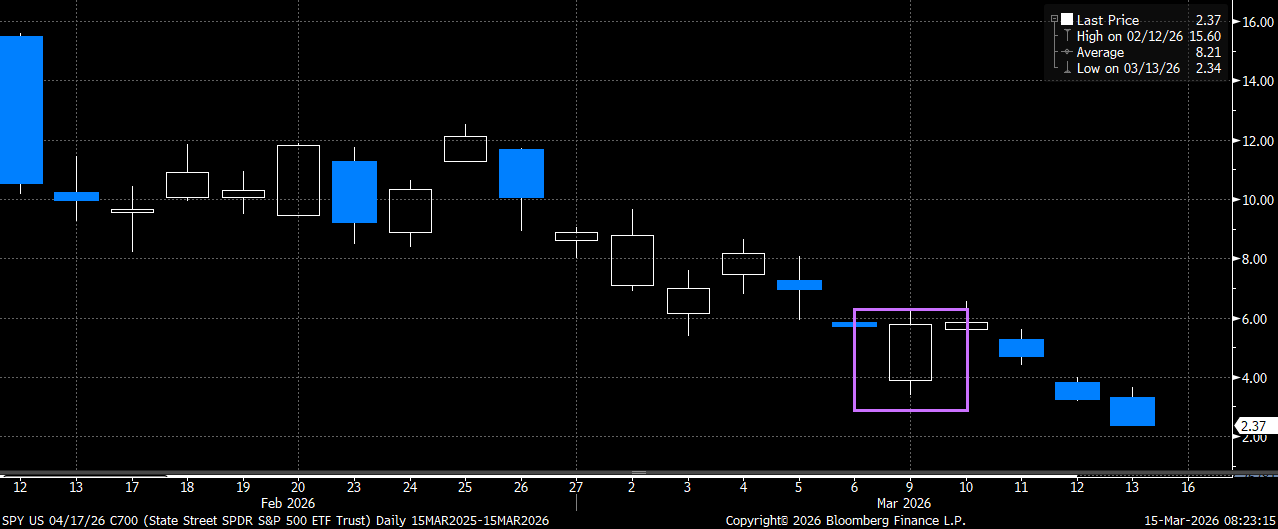
If bullish and thinking the market is “due” for a rebound (especially should we see oil move sharply lower on positive news out of the Middle East), owning calls outright also presents a problem. We saw a glimpse of this last Monday when the market rallied ~ 1%, yet upside calls in April literally were flat. On just a 1% move higher, we saw upside call vol decline by 3-4 vol points in a matter of hours. At least on the puts side we would expect vol to remain constant on a 1% decline, but on the call side the long vol component really works against you here.
The SPY April 17th SPY 600 calls closed FLAT on Monday, even as the market staged a 1% rally (thanks to call vol dropping by 3-4 points)
Unless something changes dramatically on the realized vol front, the only way to counter this dynamic of “expensive” implied vol and somewhat muted realized vol is to own structures that are net short vol as part of your desired objective. I have continued to suggest put spread collars on the index level, and nothing in the market action the past few weeks has changed my view that this remains the “best” way to hedge a continued bleed lower in the markets. If more bullish, then I would suggest either selling an “expensive” downside put at a level where you would be ok adding long market exposure to buy an upside call spread, or at a minimum consider buying ratio call spreads (say buying 1 call versus selling 1.5x of a further upside call). All of these structures should mitigate the higher volatility and improve the chances that the trades actually perform how you would expect them to do in a “normal” volatility environment.
A short volatility overlay trade idea
A new trade I wanted to highlight is to just sell “rich” volatility as a portfolio overlay trade. The sharp spike in implied volatility, while realized volatility trades far more muted, has created an attractive opportunity to add these overlay trades in my opinion. Let’s look at the main tech etf (QQQ) for example. Much like in SPY, we see 2-month (April) implied vol trading at a decided premium to 30-day realized vol. In addition, the etf is essentially right in the middle of the August – Jan range between 550 and 637. A trade I would consider here is to outright sell an April call and put that collectively have breakevens at/below each of those potentially key levels (550 to the downside and say 635 to the upside)
Trade:
Sell QQQ April 17th 575 puts
Sell QQQ April 17th 610 calls
Trade COLLECTS ~ $23.10 (QQQ 593.72 Fri close ref)
Trade Details:
- Trade is delta neutral to start
- Trade is short vol/vega with a large positive theta profile
- Breakeven to the upside is 633.10 and to the downside it is ~ 552 (6.6% higher and over 7% lower)
- Trade yields just below 4%, which is ~ 42.5% on an annualized basis
- Great way to use current weakness AND spike in implied vol to your advantage
- The 7% downside breakeven on the trade is MORE than the index is currently down from the Jan highs
- Please reach out to me or the 22V sales team for updated pricing and execution capabilities
The GREEN area highlights where this vol sale overlay trade is profitable at the April 17th expiration date