

Searching For Software Fair Value: One of the questions we are asked the most is when to buy Software (ex Hyperscalers, which is a separate debate). We don’t have any expertise in Software, but we can apply our Fair Value model[1] to S&P 500 Software to help provide anchors for different scenarios. If you’d like a copy of our model to plug in different assumptions, just let us know.
Bottom line – The long side is not compelling for the S&P 500 Software ex Hyperscale’s group. That being said, if some software companies are large AI winners and many others are losers, from here; the software index is a less compelling short. If you have a strong view on Software ex Hyperscale’s margins holding near current levels over the next 3-5 years and a significant increase in Software ex Hyperscale’s cash returns from current levels, being long the group could make sense. That does not seem like an easy call to make now though.
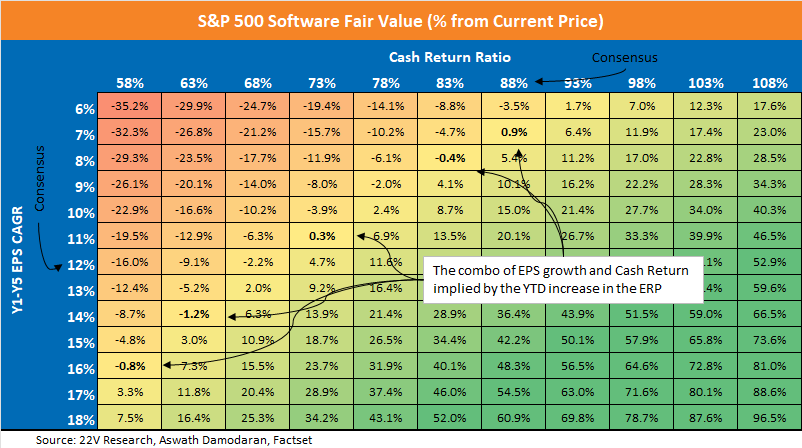
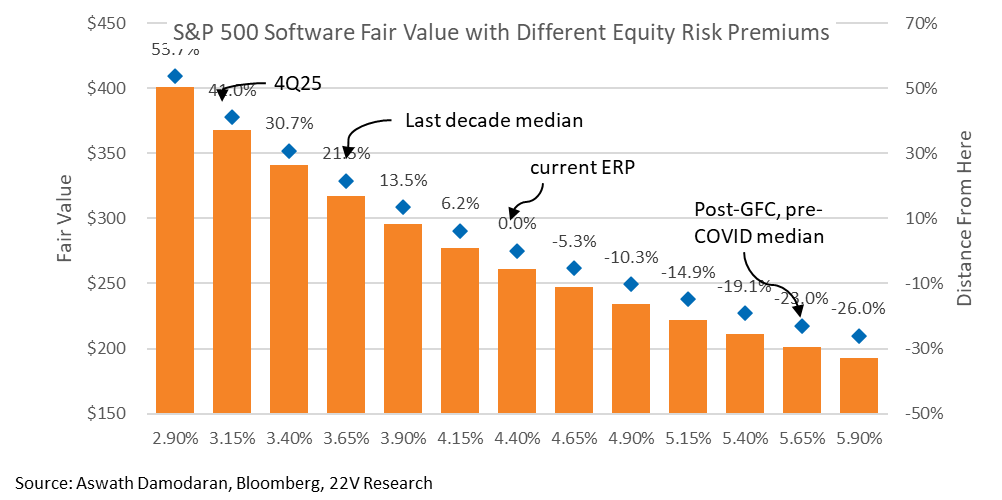
The move in valuations is discounting significant declines in earnings estimates or cash return. On their own, valuations imply the forward EPS CAGR falling from 12% to 6%, or Cash Return falling from 88% to 58%. Together, something like a ~75% cash return ratio and an EPS CAGR of 10% is being discounted. There is also upward pressure on the ERP (downward pressure on PEs) thanks to higher expected earnings vol and lower expected margins. Details in the report below. We withhold judgment of what is being discounted, instead focusing on what the change in valuations implies and how we would think about valuation on its own.
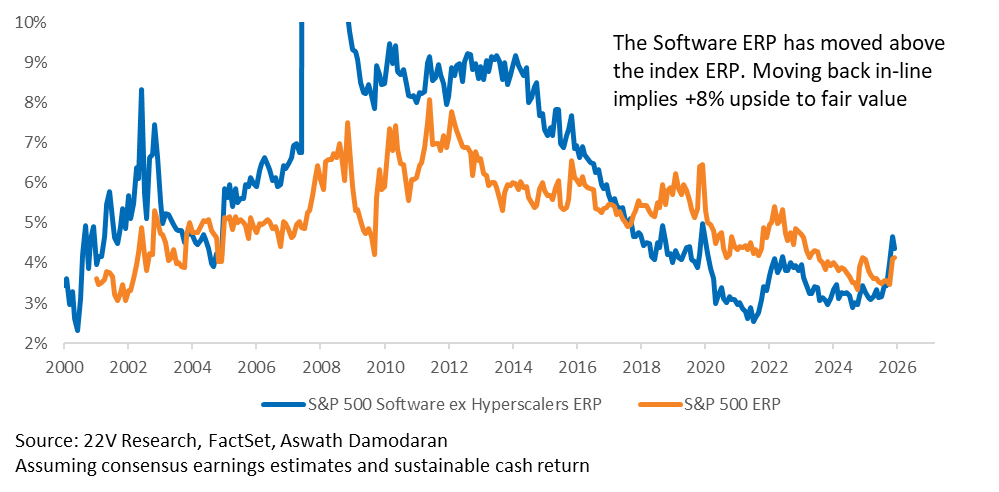
It is worth considering a scenario in which the winners vs losers within Software average out at an index level. Some have their moats eroded, but some use AI to improve profitability. If that happens, the implied equity risk premium[2] (ERP), which is currently above the S&P 500 (PE lower vs S&P 500) is biased to move back in-line with the S&P 500. The upside to current fair value would be +8% in that scenario. If S&P 500 software estimates are going to stay at an EPS CAGR of 10% and cash returns of 75%, which is in-line with the broader index, then the ERP is biased to move in-line with the index over time as well. If most of Software is in trouble, this scenario does not make much sense. Currently Software cash returns as a percentage of net income being at 58%, with EPS estimates that are stable, is just bad. That being said, this metric could improve over the coming months OR the increase in investment, that would be associated with lower cash returns, could lead to earnings estimates increasing significantly.
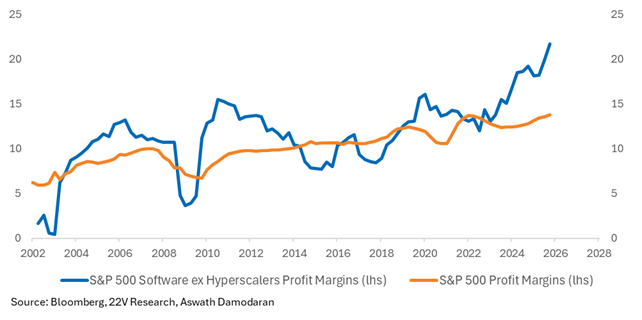
Something to Think About – S&P 500 software names have significantly higher margins than the S&P 500. Historically, equity risk premiums are lower (PE’s higher) for groups of stocks with higher margins and vice versa. Significant downside risk to software margins is being discounted. That is fair. BUT, again, there is a scenario in which the winners vs losers within Software average out and aggregate margins remain around current levels. In that scenario there is much more upside risk to fair value vs the +8% mentioned above.
Although we exclude the Hyperscalers from this exercise, Oracle’s earnings last night were interesting and representative of the bull case. Ben Thompson of Stratechery has a great summary HERE. We get that developments in AI are existential threats for many Software company revenue and margins. The burden of proof still seems to be on Software proving it won’t be displaced. However, right now, at least some SAAS companies are using and providing AI profitably. The Co-CEO of ORCL went through the reasons why on the call (*we cut and pasted his comments at the of the report). Again, all that’s necessary in the +8% RELATIVE upside case is for enough companies, not all, to benefit from AI.
Full report below…
Walking Through Fair Value Ranges – Valuations are moving ahead of some combination of lower earnings estimates, a lower cash return ratio, and/or higher earnings volatility. The first step is assessing what combination of earnings and cash return has been discounted already. This chart of the S&P 500 Software, ex Hyperscalers Equity Risk Premium (ERP) gives historical context for the move higher in the ERP (consistent with a lower PE).
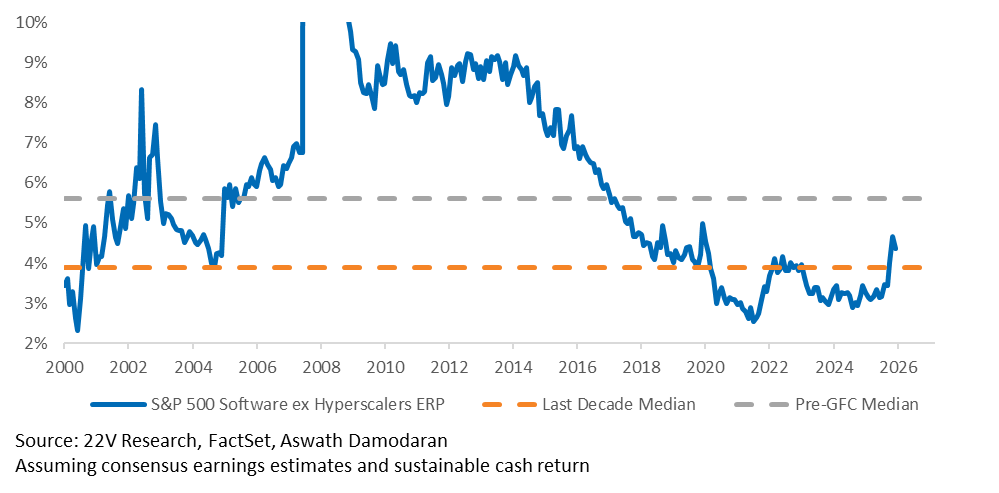
Leaving the mechanics of our model for the appendix, the below table maps out the plausible combinations of earnings growth and cash return. To do this, we set the ERP back to what it was at the start of the year, and back into which combos of EPS and cash return lead to fair value at the current index level. That would be the logic if the increase in the ERP is simply moving ahead of consensus eps and cash return estimates.
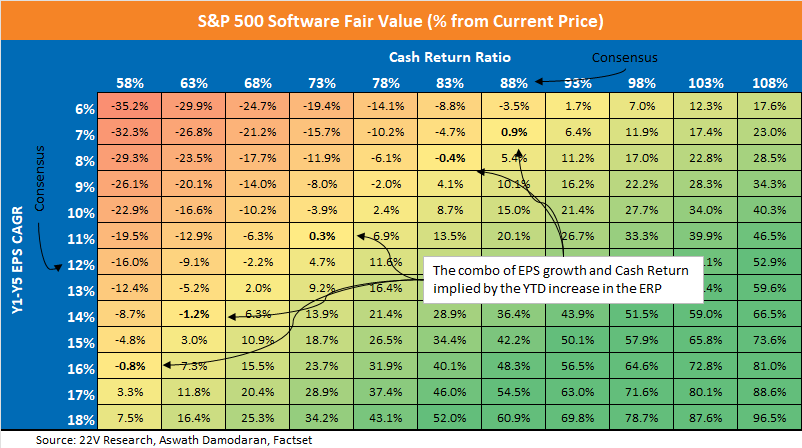
We won’t hazard a guess at whether the current discounting is fair or not, but we’ll walk through some examples to help illustrate what’s priced relative to recent history.
Cash return dropped to 58% in 4Q as Software companies pivoted away from dividends and buybacks. Our Software ex Hyperscalers basket would be fairly valued at current levels, assuming cash return stays at 58%, if EPS estimates increased from a CAGR of 12% to 16%. Put differently, if cash return stays at 58% and consensus EPS estimates are right, fair value is another -16% from here. It is likely investors are discounting some recovery in cash return. Fair Value under different cash return ratios is charted below. The chart below is the most important one for fair value in our view. If Software moats are collapsing permanently, cash returns should be more permanently impaired relative to history.
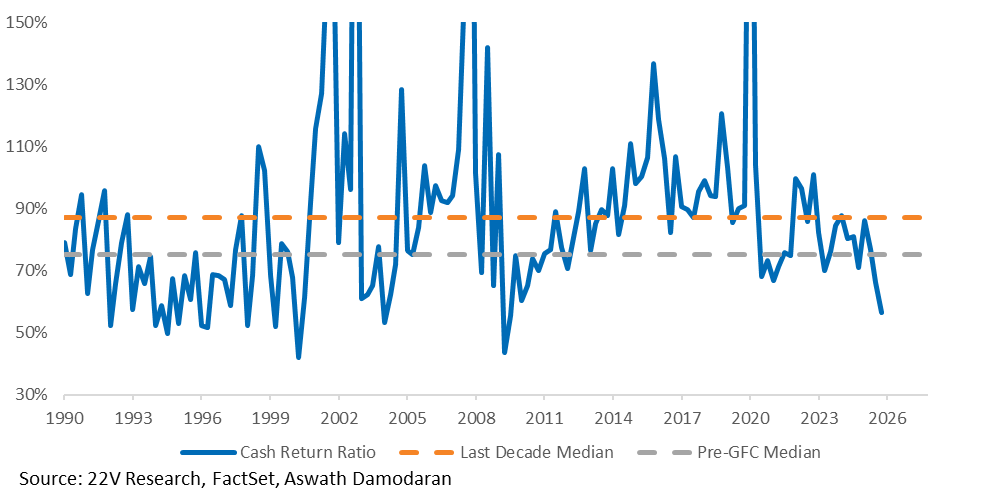
The fair value fair scenarios presented below assume that the implied ERP stays at current historically elevated levels.
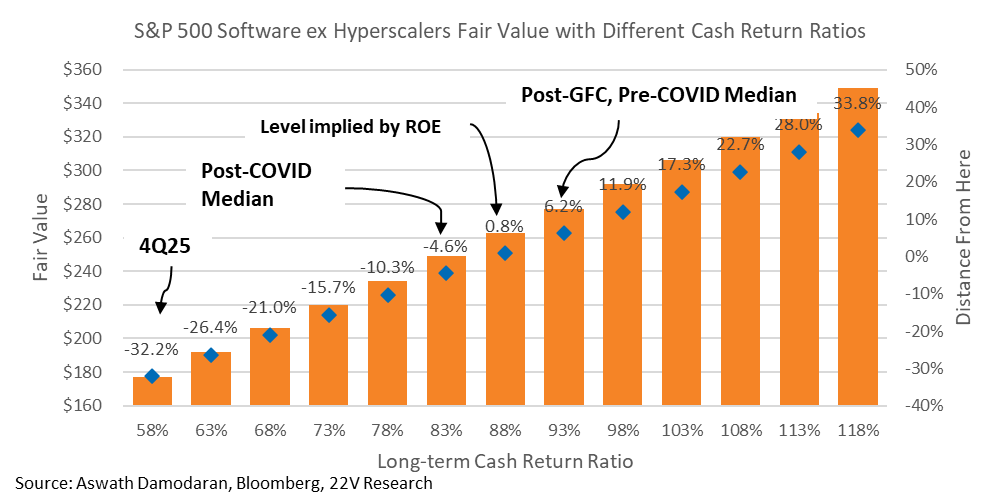
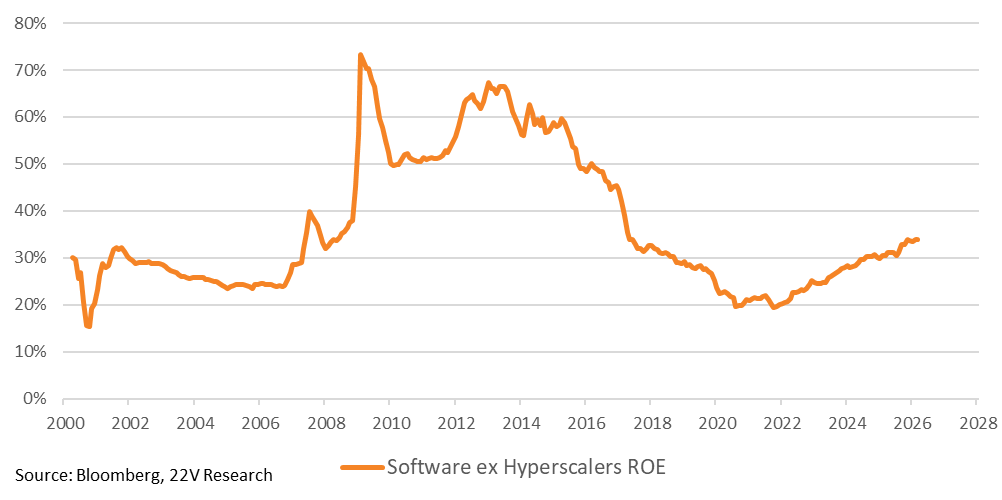
Thinking Through Cash Returns Drivers – A much lower ROE is being discounted currently:
The “sustainable” cash return level based on ROE implies cash return will rise back up to 88% of net income, which is also the rolling 10yr average of realized cash return. The sustainable level uses ROE to calculate how much earnings Software needs to retain to grow earnings at the risk-free rate. The rest is returned as cash.
There is obviously more uncertainty over ROE now. If Software’s moats are eroded, then their ROE will fall and the amount of earnings they need to retain to grow at the risk-free rate increases (and so long-term cash return falls). Fair Value with different ROEs is charted below, along with the ROE over time for historical context. If the ROE declines to pre-GFC levels, there is SIGNIFICANT downside risk to Software names.
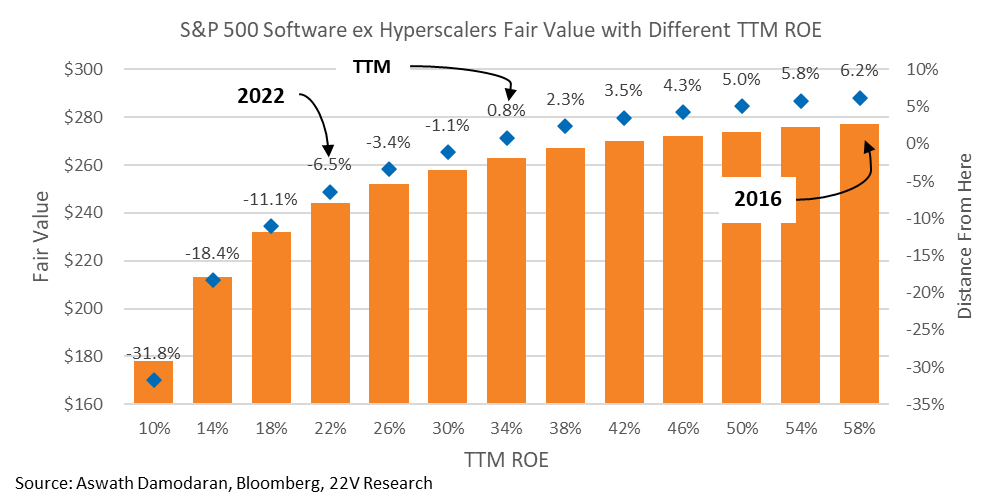
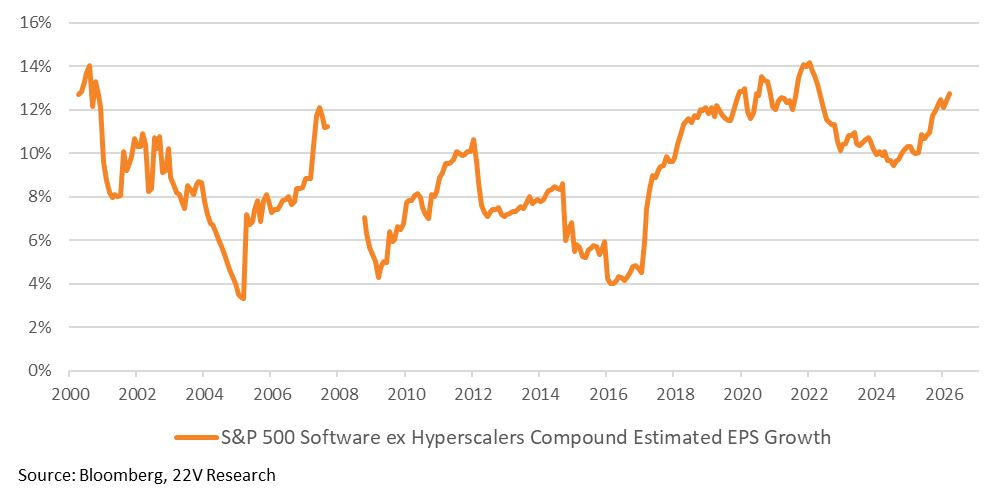
If investors are assuming cash return rises to its “sustainable” / recent historical level of 88%, then the index would be fairly valued with a consensus EPS CAGR of 6%. Current estimates, which have barely moved YTD, are for 12%. Estimates have not been at 6% since 2017. Chart below for context. Fair Value under different EPS CAGRs charted below.
Highlighting this matrix again as it should be more intuitive after going through the details above.
Lastly, a note on the Implied Equity Risk Premium (ERP) – We have discussed what it is moving ahead of, but not a target for it on its own. We consider two inputs here: 1) the volatility of earnings and 2) the outlook for margins. There is a modest relationship between the vol of earnings and margins and the ERP independently, so we don’t want to approach this exercise with false precision, but together vol and margins help build the case.
A regression of rolling vol in the CAGR of expected earnings implies a 1pp rise in vol is associated with ~75bps higher implied ERP. The rolling correlation has recently risen to 80%, implying that this matters right now. Again, avoiding false precision here, but higher implied earnings vol will put upward pressure on the ERP. The ERP is up 150bps so far, equivalent to +2pp of earnings vol.
Software has gotten more “expensive” as margins improved since the GFC. To use a kludge, the current ERP is the highest since margins were ~13%. Margins were 22% in 4Q. We don’t know how much to haircut Software margins, but it’s a good place to start for thinking about the right ERP.
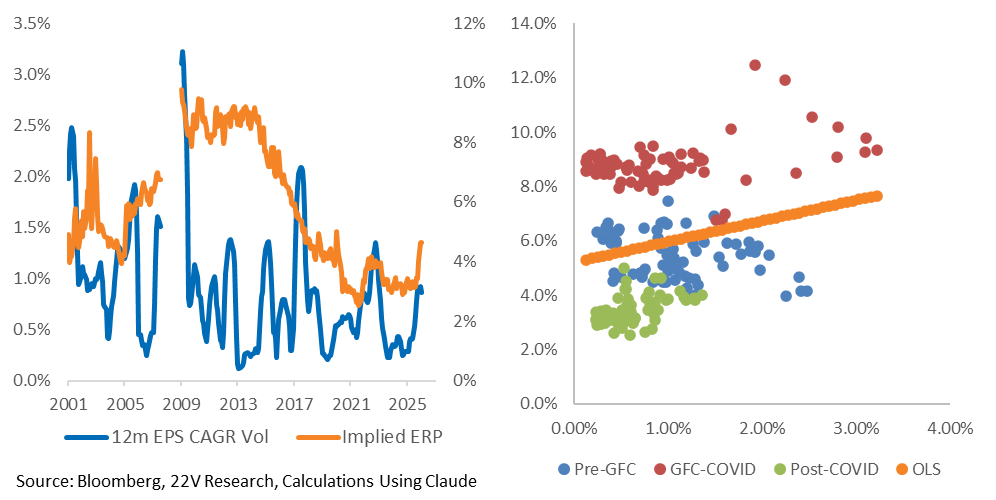
Finally, consider a case in which AI opportunity and disruption average out at the index level. In other words, some firms use AI effectively, some are displaced by it. This would bias the ERP back in-line with the index. That opens up +8% fair value. The vol of the earnings should be less of an issue for ERPs if the winners and losers are identified quickly. The quicker investors identify winner and losers, the quicker the ERP can move toward S&P 500 levels OR below. And vice versa.
Let us know if you want the model to plug and play.
Downside risk to software margins are being discounted. That is fair. BUT, again, there is a scenario in which the winners vs losers within Software average out and aggregate margins remain around current levels. In that scenario, there is much more upside risk to fair value vs the +8% mentioned above.
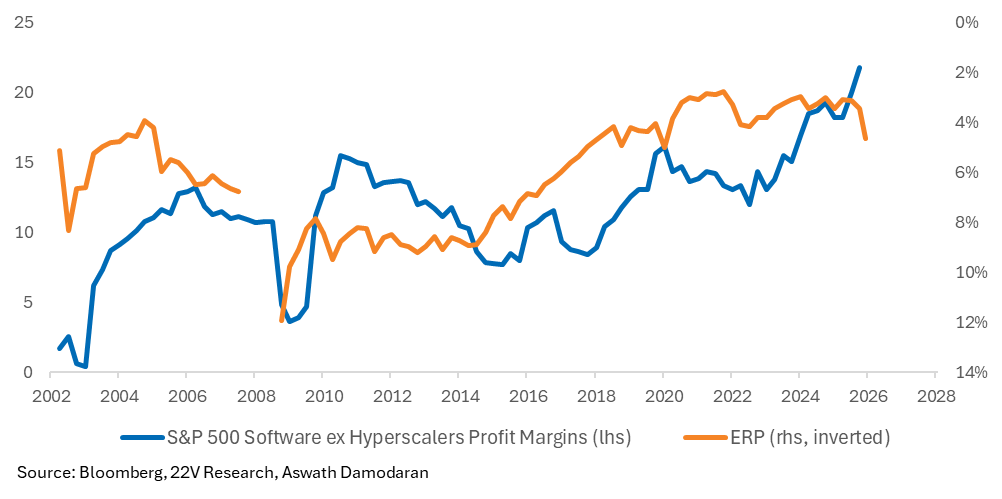
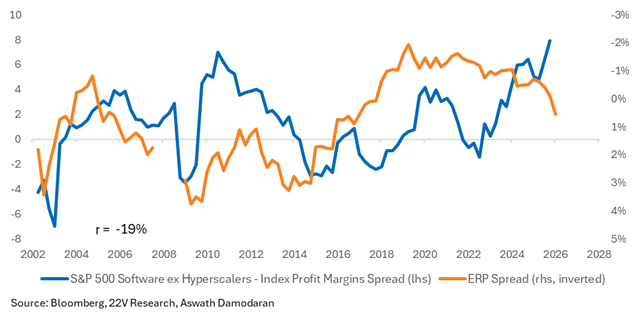
The implied ERP seemed to discount higher profits margins for Software names, which is why we should not dismiss what the ERP is currently discounting. Below is S&P Software ex Hyperscalers – S&P 500 profit margins (blue line) vs the Implied equity risk premium for Software ex Hyperscalers vs the S&P 500 (orange line).
*Comments from the Co-CEO of ORCL. “I’ll say a few words about the reported SaaS apocalypse. You’ve all heard the thesis or theory that new companies coding quickly using AI will spell the death of SaaS. I don’t agree with that at all. I do think that AI tools and their coding capabilities would be a threat if we weren’t adopting them, but we are and very rapidly. Oracle is using the best AI coding tools and the best developers not only to accelerate our SaaS business but to deliver solutions that enable entire ecosystems across numerous industries. The use of AI coding tools inside Oracle is enabling smaller engineering teams to deliver more complete solutions to our customers more quickly. We are building brand-new SaaS products using AI and also embedding AI agents right into our existing applications suites.
By embracing AI with small engineering teams, we have just built three brand-new CX applications, lead generation and qualification, sales orchestration and automated selling and our new website generator. In fact, we just used the website generator to build and launch the new oracle.com. We’ve built these new CX products to help our customers sell, not simply to administer a forecast or generate e-mail opens. These are three products that Salesforce.com does not have. And of course, Salesforce.com also doesn’t have OCI, the AI Data Platform, Fusion ERP and complete industry suites. Complete AI-powered end-to-end ecosystem automation platforms are quite unique to Oracle.”
Our Fair Value model is based off the work of valuation guru Aswath Damodaran. It is a DCF style approach that is akin to valuing an index like a single stock. The cash that is discounted is the cash returned to investors through dividends and buybacks. This approach has helped us work through valuations in a way that is more tangible than say an NTM PE. ↑
Our preferred cash-return based valuation metric, based on the work of Aswath Damodaran. Good resource on it HERE. ↑

