Back AI Macro Nexus Research

Round 1, Fight 1

Published on March 4, 2026

Download the PDF Report

By

Jordi Visser

Turbulence Signals in the AI Disruption Regime
Source: 22V Research

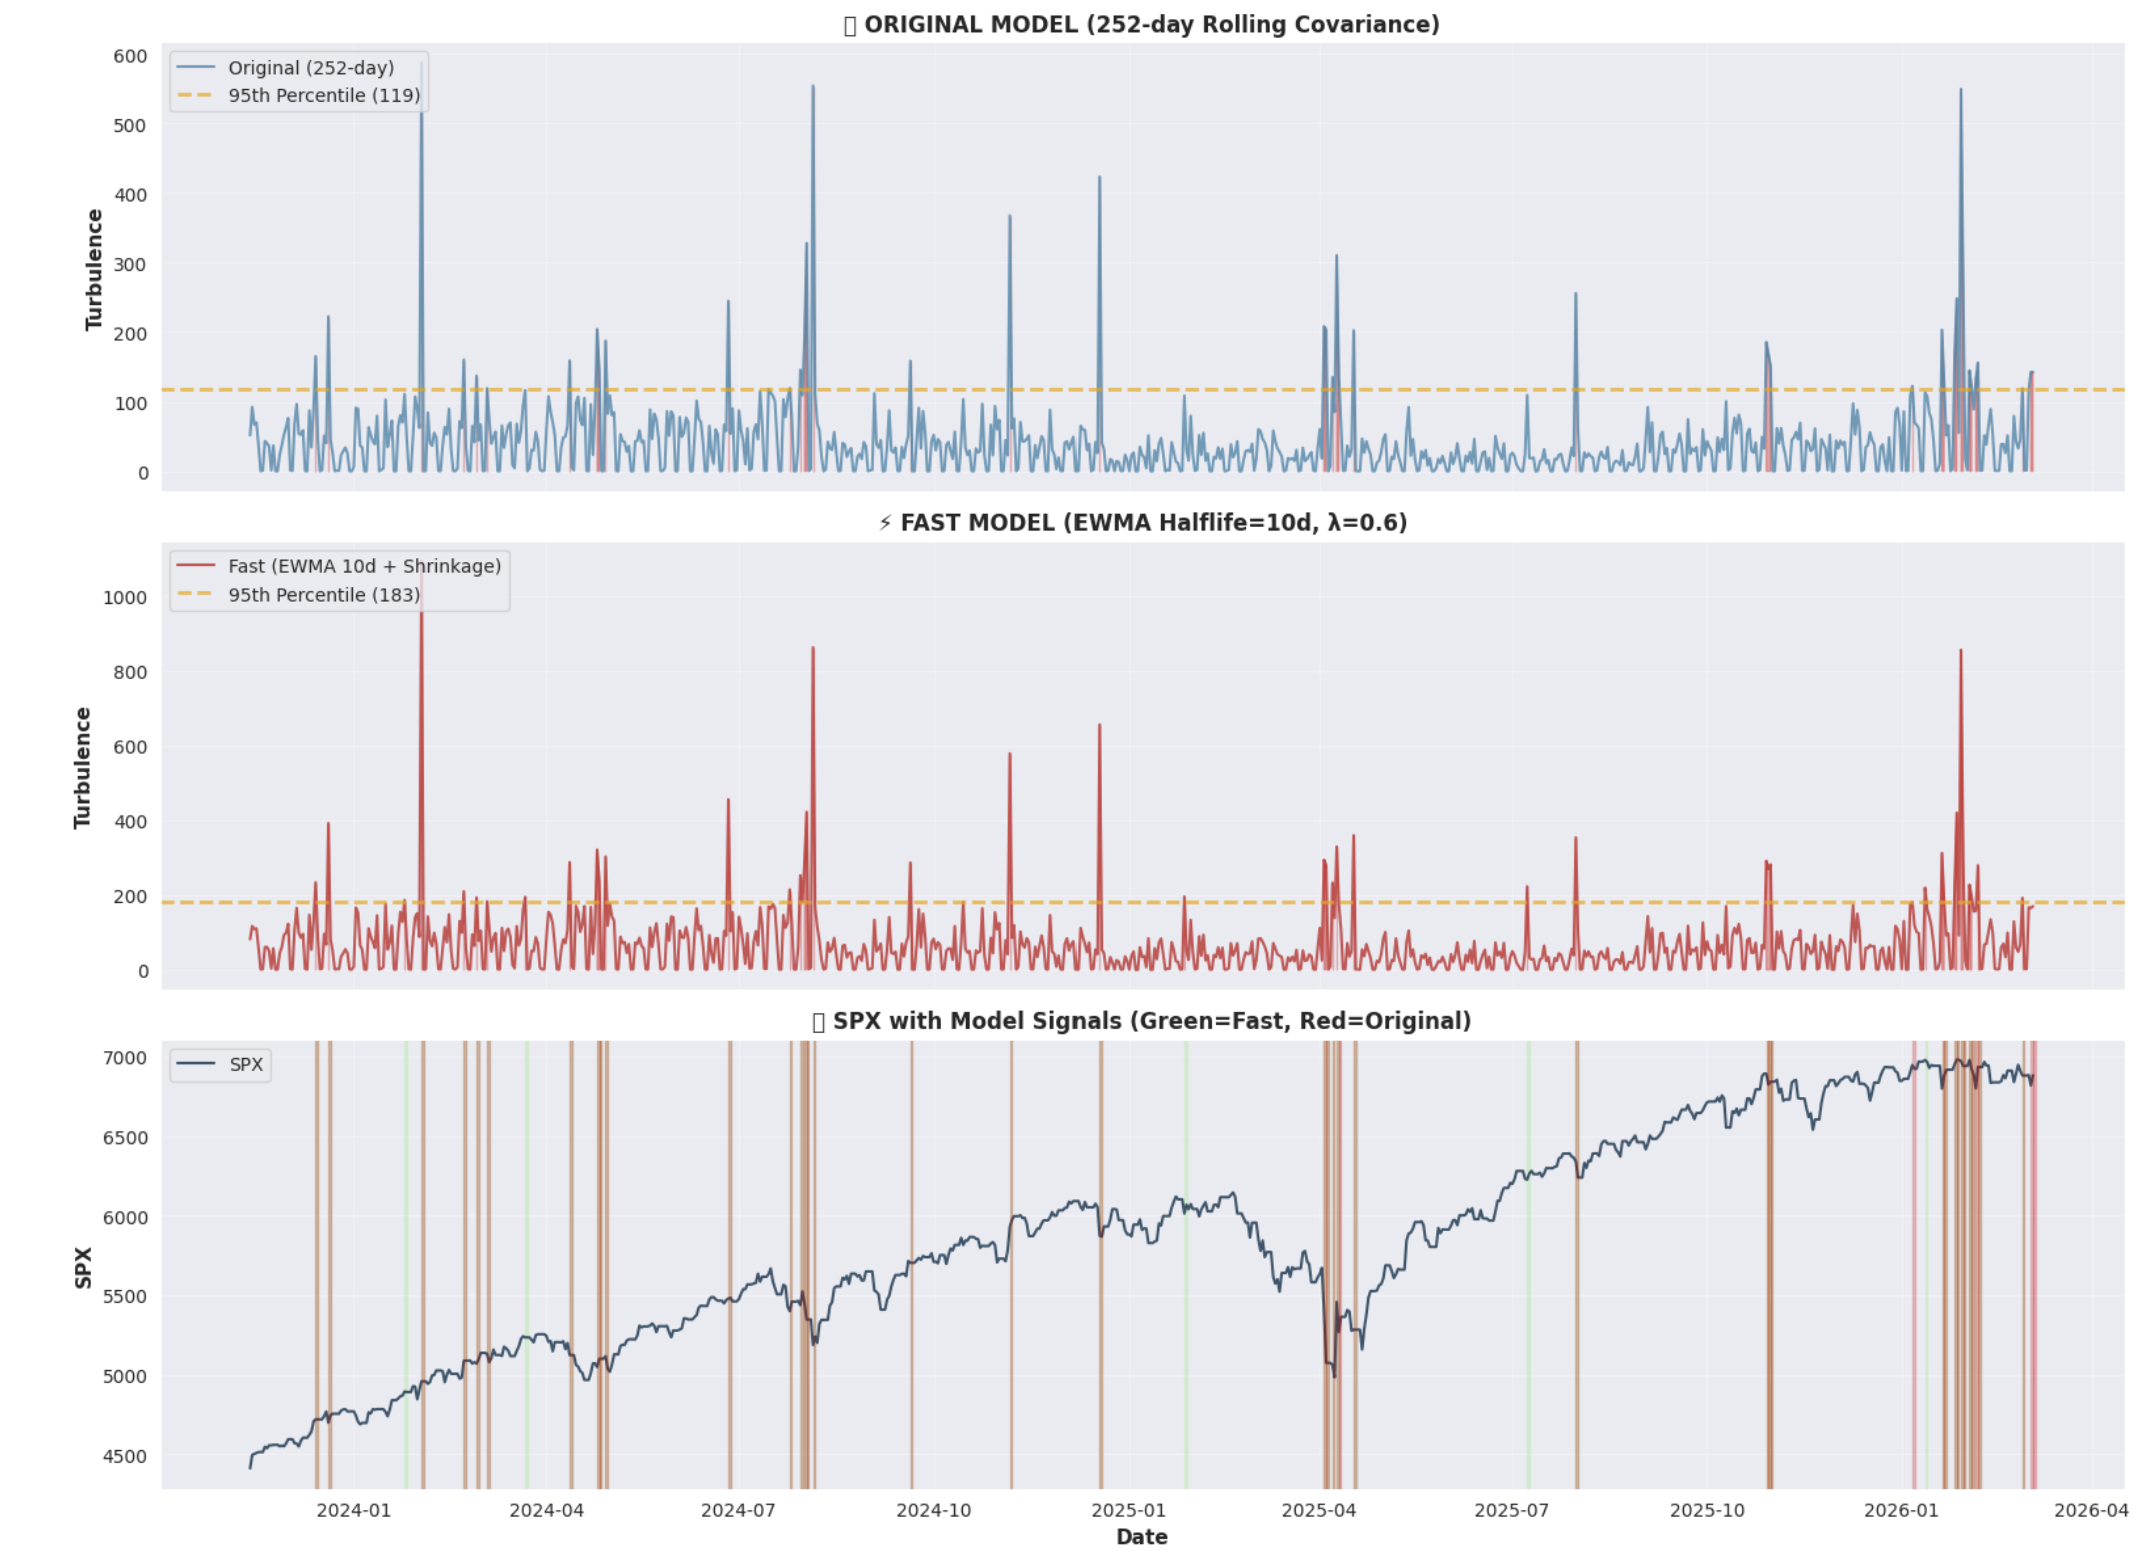
I have received a number of inquiries about the turbulence model, so I thought the easiest way to explain what is happening was to put together a short note. I also added a couple of new features to the framework to better reflect the environment I believe we are entering, which I discussed in the paper I sent out this morning on the structural changes emerging from the AI disruption regime.

The top chart shows the original version of the model. You can see the large spike in early February, which occurred after three consecutive days of elevated turbulence readings at a time when the S&P 500 was still above its 50-day moving average and the VIX remained low. The model uses a 252-day (one-year) rolling covariance approach, which measures how unusual current cross-asset movements are relative to the past year. It is difficult to see on the chart, but the last three days have also produced three consecutive elevated readings. For those watching their PnL recently, that likely does not come as a surprise.

Because I expect the coming environment to feature higher volatility of volatility, I also introduced a second version of the model that uses an exponentially weighted covariance approach. This places more emphasis on recent market behavior, allowing the model to adapt more quickly to changes in correlations and volatility. The system therefore now measures market stress in two different ways simultaneously. The original model examines how assets across the global market normally behave relative to each other over roughly the past year and then asks whether today’s movements are unusual compared with that longer history. Because it uses a full year of data, it reacts slowly and produces relatively few signals, but those signals tend to represent meaningful structural stress rather than short-term noise. In the chart, this appears as occasional large spikes that cross the threshold line. When that happens, it means relationships across equities, bonds, commodities, currencies, and volatility have shifted in a way that has been rare over the past year.

The new version of the model operates much faster because it emphasizes what has happened in the most recent days and weeks rather than treating the past year equally. This makes it more sensitive to sudden changes in market behavior. As a result, the turbulence readings in the second panel spike more frequently and more dramatically because the model reacts quickly to shifts in volatility, sector rotations, and correlation changes across markets. These signals often appear before the slower model detects anything, which means the fast model can highlight early instability that is just beginning to develop. At the same time, because it is more sensitive, it also produces temporary signals that do not always lead to major market moves.

When these signals are overlaid on the S&P 500 in the bottom panel, a clear pattern emerges. The fast model typically flashes warnings first, while the slower model confirms them later if the instability persists. In that sense, the fast model acts as an early detection system, while the original model serves as confirmation that the disturbance has become more significant. Recently, the chart shows a cluster of signals from the fast model and several signals from the slower model as well, even though the S&P 500 remains near its highs. That combination suggests the internal relationships between markets are becoming less stable beneath the surface, which is precisely the type of environment this turbulence framework is designed to identify.

Two things stand out to me when thinking about the current regime. First, we have seen more elevated turbulence readings than at any point over the past three years. Second, historically when clusters of elevated readings occurred, the S&P 500 had usually already declined. Today that is not the case as we still sit near the all-time highs. This dynamic aligns with the environment I have been writing about this year. It is why I titled this note Round 1, Fight 1. Once Rocky Balboa knocked down Apollo Creed, we knew it was going to be a long fight. Investors should prepare for the same kind of environment ahead.


DISCLOSURES AND DISCLAIMERS

Analyst Certification

The analyst, 22V Research Group, primarily responsible for the preparation of this research report attests to the following: (1) that the views and opinions rendered in this research report reflect his or her personal views about the subject companies or issuers; and (2) that no part of the research analyst’s compensation was, is, or will be directly related to the specific recommendations or views in this research report.

Analyst Certifications and Independence of Research.

Each of the 22V Research analysts whose names appear on the front page of this report hereby certify that all the views expressed in this Report accurately reflect our personal views about any and all of the subject securities or issuers and that no part of our compensation was, is, or will be, directly or indirectly, related to the specific recommendations or views of in this Report.

22V Research (the “Company”) is an independent research provider. The Company is not a member of the FINRA or the SIPC and is not a registered broker dealer or investment adviser. 22V Research has no other regulated or unregulated business activities which conflict with its provision of independent research.

22V Research, LLC is a professional services and independent publication organization. 22V Research, LLC is not a securities broker-dealer, not a member of the Financial Industry Regulatory Authority (FINRA), not a registered investment advisor (RIA) and not a member of SIPC.

Securities transactions, when offered, are offered by 22V Securities, LLC through LPS Capital, LLC. Certain employees of 22V Securities, LLC are dually registered as securities representatives of LPS Capital, LLC or Analyst Hub Securities, LLC. 22V Securities, LPS Capital and Analyst Hub Securities are members FINRA, SIPC.

https://brokercheck.finra.org/

Current Ratings Definition.

SECTOR OUTPERFORM: An “outperform” rating anticipates the company will outperform the S&P Regional Banking Index (peer group).

SECTOR PERFORM: A “market perform” rating anticipates the company will perform in line with the S&P Regional Banking Index (peer group).

SECTOR UNDERPERFORM: An “underperform” rating anticipates the company will underperform the S&P Regional Banking Index (peer group).

Limitation Of Research And Information.

This Report has been prepared for distribution to only qualified institutional or professional clients of 22V Research Group. The contents of this Report represent the views, opinions, and analyses of its authors. The information contained herein does not constitute financial, legal, tax or any other advice. All third-party data presented herein were obtained from publicly available sources which are believed to be reliable; however, the Company makes no warranty, express or implied, concerning the accuracy or completeness of such information. In no event shall the Company be responsible or liable for the correctness of, or update to, any such material or for any damage or lost opportunities resulting from use of this data. Nothing contained in this Report or any distribution by the Company should be construed as any offer to sell, or any solicitation of an offer to buy, any security or investment. Any research or other material received should not be construed as individualized investment advice. Investment decisions should be made as part of an overall portfolio strategy and you should consult with a professional financial advisor, legal and tax advisor prior to making any investment decision. 22V Research Group shall not be liable for any direct or indirect, incidental or consequential loss or damage (including loss of profits, revenue or goodwill) arising from any investment decisions based on information or research obtained from 22V Research Group.

Reproduction And Distribution Strictly Prohibited.

No user of this Report may reproduce, modify, copy, distribute, sell, resell, transmit, transfer, license, assign or publish the Report itself or any information contained therein. Notwithstanding the foregoing, clients with access to working models are permitted to alter or modify the information contained therein, provided that it is solely for such client’s own use. This Report is not intended to be available or distributed for any purpose that would be deemed unlawful or otherwise prohibited by any local, state, national or international laws or regulations or would otherwise subject the Company to registration or regulation of any kind within such jurisdiction.

Copyrights, Trademarks, Intellectual Property.

22V Research Group, and any logos or marks included in this Report are proprietary materials. The use of such terms and logos and marks without the express written consent of 22V Research Group is strictly prohibited. The copyright in the pages or in the screens of the Report, and in the information and material therein, is proprietary material owned by 22V Research Group unless otherwise indicated. The unauthorized use of any material on this Report may violate numerous statutes, regulations and laws, including, but not limited to, copyright, trademark, trade secret or patent laws.