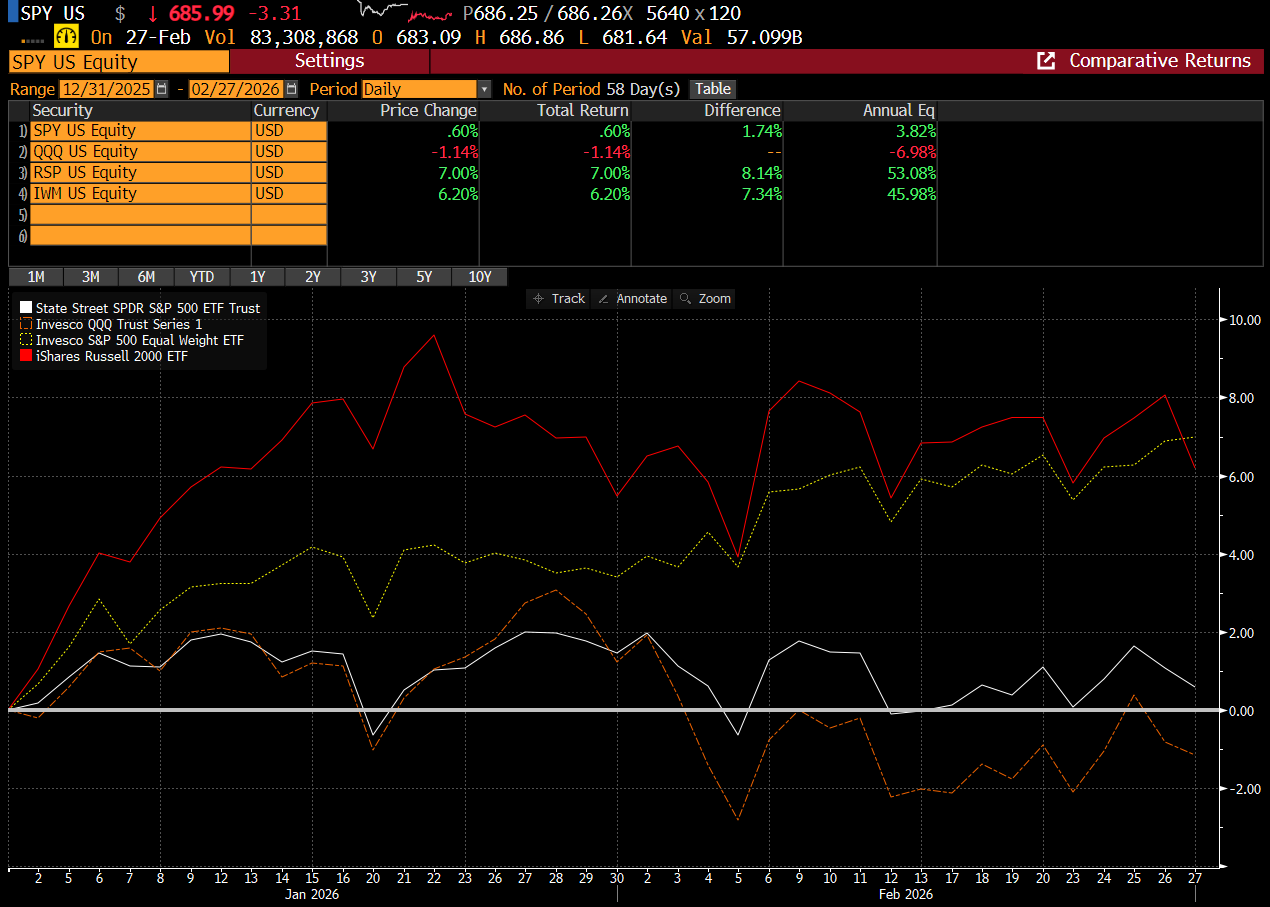
While it feels like the market is down a lot this year, the indexes keep telling a much different story. The S&P (SPY) is up small (60bps), and the Nasdaq (QQQ) is only down a bit more than 1%. The real stars year to date have been the equal-weighted index (RSP) which is up 7%, and closed at its highest level ever on Friday, and the small caps (IWM) which are up 6.2% YTD. The strength in the RSP and IWM really speaks to the broadening-out trade that 22V has been preaching for months now. The issue for most investors is they likely don’t own the equal-weighted or small cap index, but rather they own many of the names/sectors that continue to act the worst. Weakness in the Mag7, software names and the financials continues, and it is only because of the strength in the more value/defensive areas of the market that the indexes aren’t down a lot more. This clearly has been frustrating for people looking to hedge their exposure on the index level since puts can’t be monetized, while the parts of the market they own continue to bleed lower.
SPY and QQQ are flat for the year, while equal-weight (RSP) and small caps (IWM) continue to outperform
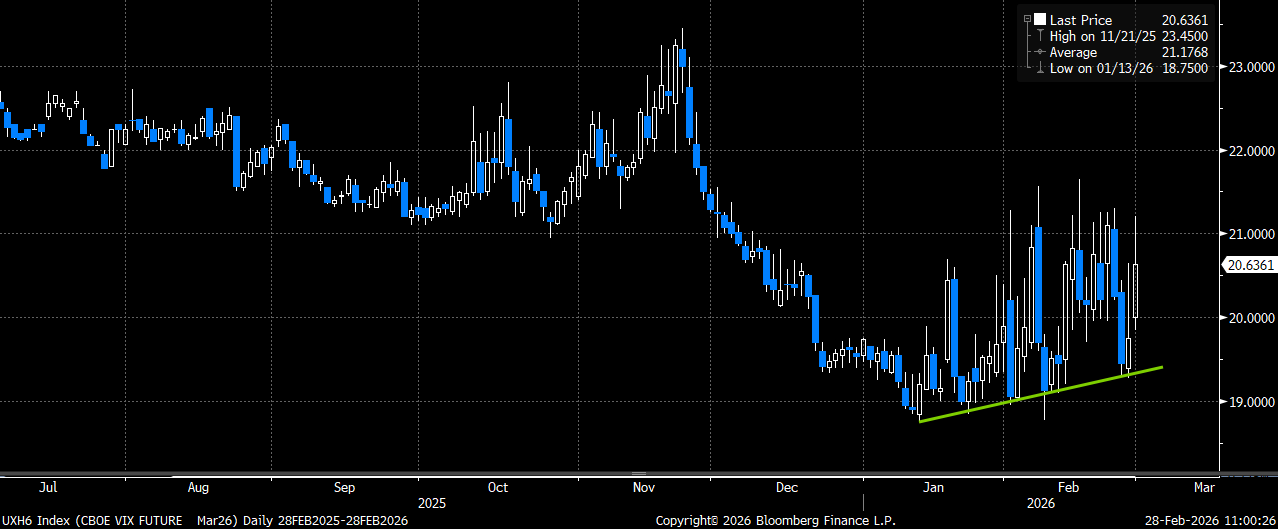
While the larger cap indexes continue to trade sideways, we keep seeing volatility move higher. One month SPY 40-delta put implied volatility bottomed in December below 12, and it was trading at over 17 on the close Friday (and that was before the weekend news on Iran). The cost to hedge is up 50% from the lows, even though realized vol remains somewhat subdued and the indexes have remained range-bound for now. VIX also continues to steadily move higher, as the March VIX futures made a low below 19 in Jan and Feb, and closed just below 21 on Friday (and that too was before the Iran news over the weekend).
SPY 1-month 40-delta put vol is ~ 50% above where it traded in December (even with index flat YTD)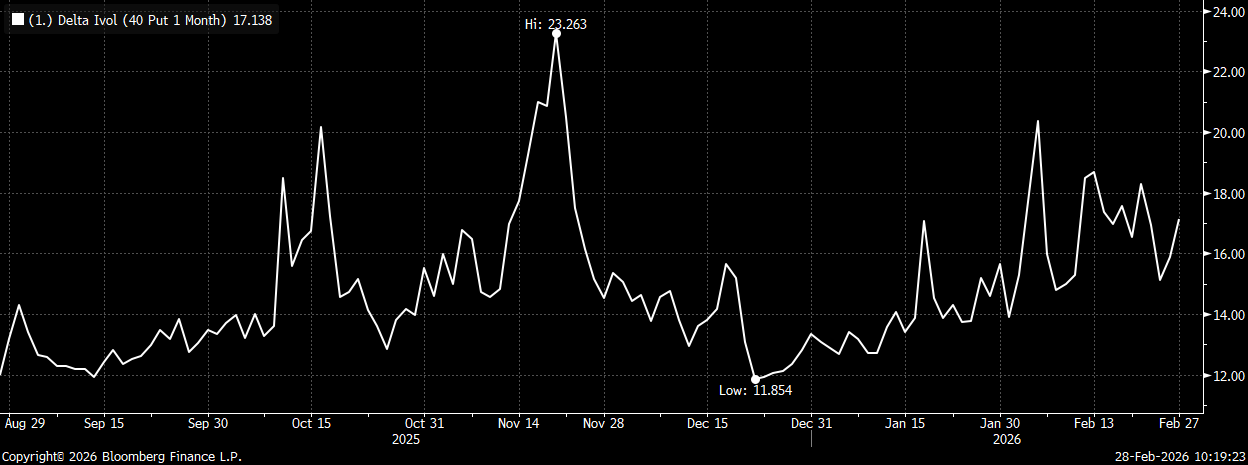
VIX March futures bottomed in January, and continue to make higher lows and higher highs
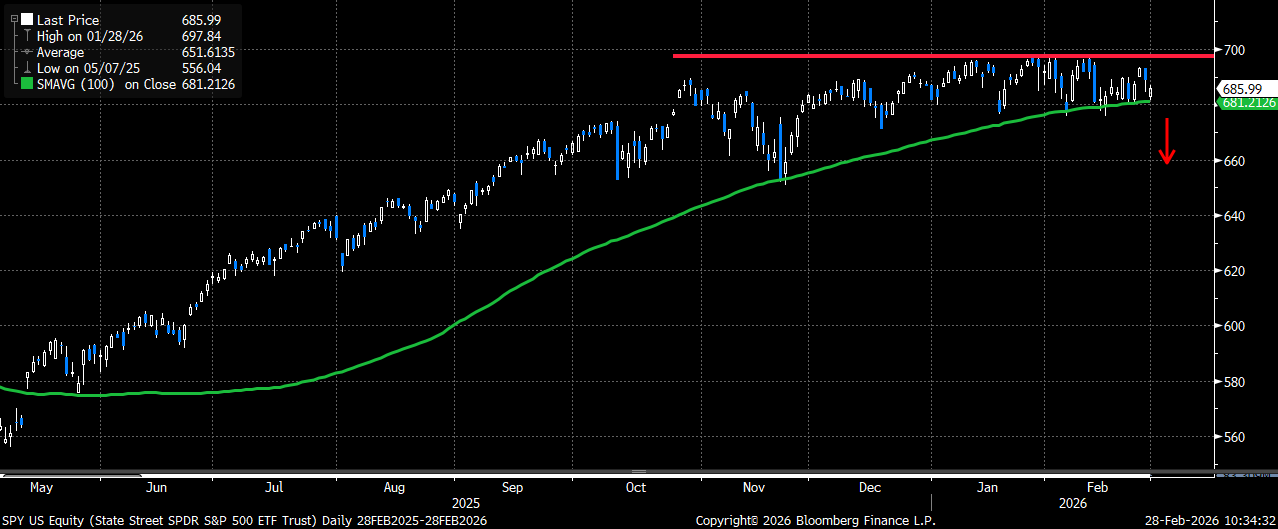
On the index level, this becomes a problem since hedging costs have gone up, yet the market remains stubbornly bid (likely because of the sharp rotation into the staples, pharma, utilities and other rate-sensitive areas). The issue for the index (SPY) is that the areas that are “working” have a far smaller weighting then the sectors that are not (like tech, financials, etc). If the weakness persists, it seems like only a matter of time until we see a breakdown of the narrow range the index has been trading in since December. I am watching the trailing 100-day moving average in SPY (currently ~ 681), as the market has remained above this technical level since gapping above it in mid-May after the tariff selloff in April. It’s very possible we breach this level when markets open tomorrow given the geopolitical news over the weekend, plus I would also expect an accompanying spike higher in volatility on this news/market reaction.
With market upside on the index level appearing limited in the near-term, a possible break below key technical support and a bigger bid to volatility, I believe the “best” hedge on the index side is to sell an upside call above the recent highs to own a downside put spread. Doing this will help offset the higher volatility, while looking to hedge a possible further decline on the index level. For SPY, I would look to sell the 700 or 705 calls to own a somewhat wide (5-7%) downside put spread that starts 2-3% below spot (preferably in April). Once markets open and we have a better idea as to the impact/reaction on the Iran news I can provide a more specific structure.
Use the clear resistance in SPY as part of an April put spread collar hedge
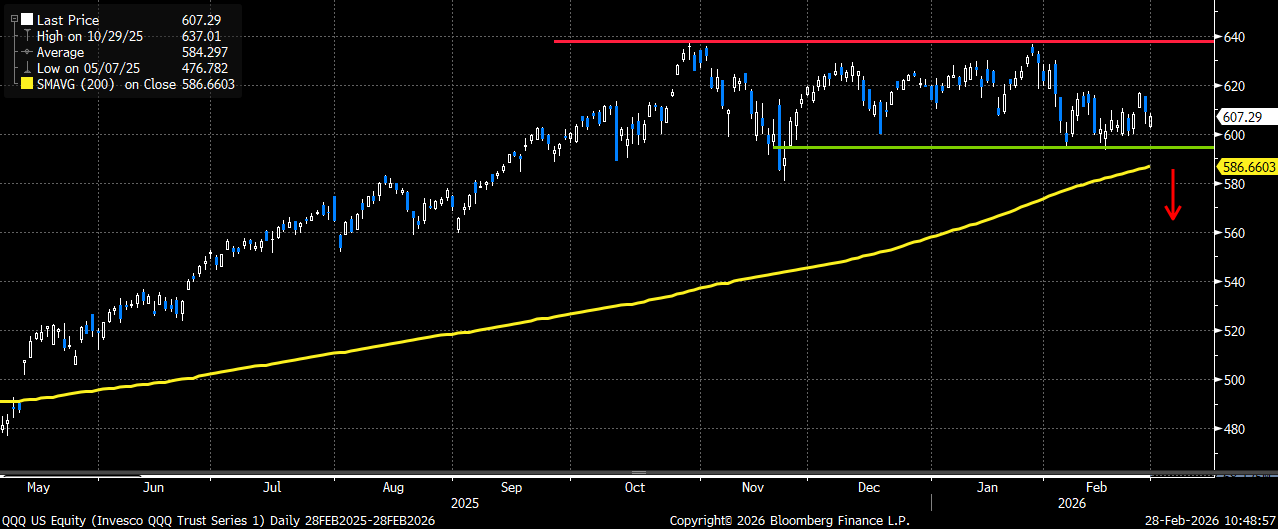
As for tech (QQQ), I suggested a very similar-type put spread collar hedge a few weeks ago (here). What’s very interesting, and why I continue to believe this structure is the “best” index hedge, is that even though QQQ is barely down since I suggested the trade three weeks ago, is that the structure has doubled in value from ~ $2.55 to over $5 in a flat tape. The short “wings” of the trade (the upside call and the downside put) help offset the large decay (theta) of the closer to the money put as we remain range bound. Since I continue to believe that upside (new highs) remains a very low probability in the near-term, given all the concerns over AI with regard to both the hyperscalers and software names, I would continue to favor this structure as a tech-based hedge. In addition, the negative reaction by Nvidia (NVDA) this week to “blowout” earnings makes me even more comfortable selling the expensive upside index call to own the protective downside put spread. I would also now consider April structures for that trade since the regular March expiry (3/20) is now less than three weeks away. I would target the 640 level as part of an April call sale to buy a somewhat wide downside April put spread that starts ~ 2-3% below spot and targets a possible break of the 200-day moving average (currently ~ 588 in QQQ). Once markets open and we have a better idea as to the impact/reaction on the Iran news I can provide a more specific structure.
QQQ also looks to have resistance in the short-term. I favor selling upside calls at the highs to own downside protective put spreads
VIX April risk-reversals are my preferred “tail” hedge
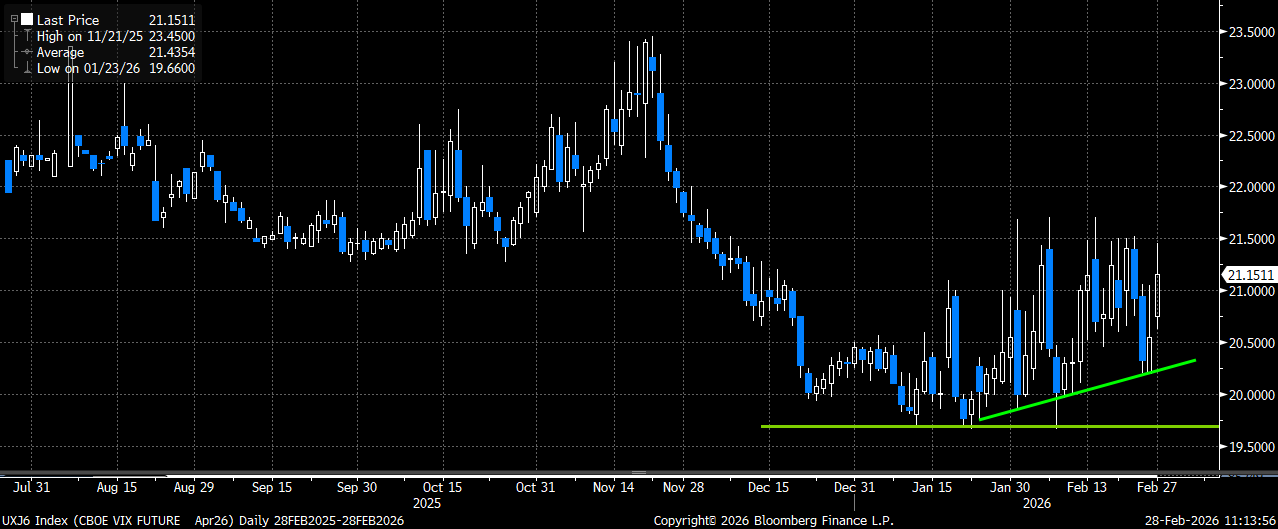
As far as tail hedges, I continue to believe VIX risk-reversals are the best way to own convexity for a meaningful decline/spike in volatility. It appears there is a real floor to volatility for now, and the Iran news likely makes that floor even more likely. Besides believing there is a floor to vol at lower levels, I also like the fact that put volatility has been rising as well as VIX call volatility (VVIX). Should we see VIX move back lower, then I would fully expect to see VIX put volatility move lower as well. While I mentioned the March VIX futures above, and the likely floor in vol ~ 19, the April futures look to have a similar-type floor in vol (on a somewhat higher level). Therefore, I would consider selling a put below that level (say April 18 put) to own an upside call. Again, we need to see the impact on volatility when we open on Monday but would be happy to update this trade once we open.
VIX April futures with a similar profile to March futures