Back AI Macro Nexus Research

Supersonic Tsunami: Why the Market’s Stress Signals Are Flashing 10x More Than Normal

Published on February 13, 2026

Download the PDF Report

By

Jordi Visser

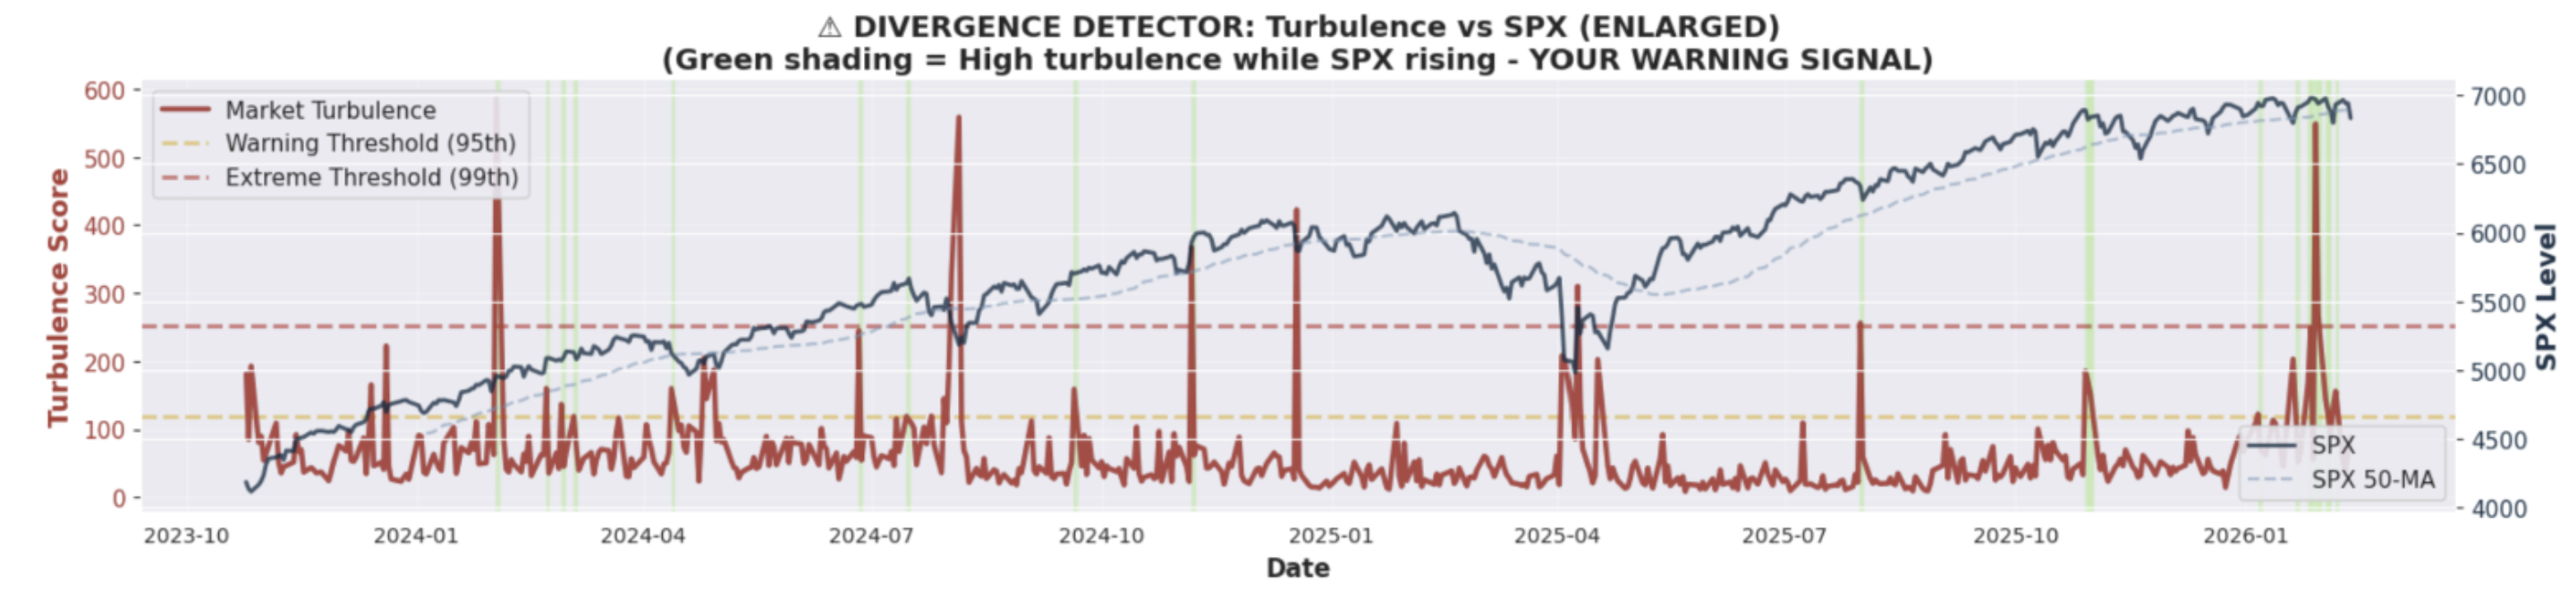
This month it has become clear that something big is happening underneath the market. AI is causing uncertainty on the value of long-duration software assets, forcing a re-rating as investors question the disruption of AI across sectors. At the same time, a surprise rise in PMIs has helped accelerate a rotation from growth to value, creating cross-currents that are destabilizing relationships across sectors, factors, and stocks. Early in February I got a warning signal on my turbulence model and posted it on X. The warning requires three conditions to fire simultaneously: first, a covariance shock, which simply means assets that normally move independently are suddenly moving together in unusual and volatile ways, breaking the “normal” relationships that risk models depend on; second, VIX remaining low, indicating the options market isn’t yet pricing in fear; and third, SPX still trading above its 50-day moving average, meaning price action still looks healthy. When all three conditions occur together, it signals hidden stress that hasn’t yet surfaced in traditional indicators, the kind of divergence that historically precedes larger dislocations.

The numbers are becoming alarming. From 2023 through 2025 – a span of roughly 28 months – the model generated approximately 20-25 warning signals, or less than one per month. In the first six weeks of 2026 alone, I’ve recorded 12-15 warning signals – a rate of 8-10 per month, with most of those occurring this month, representing a 10x increase in frequency. The market keeps experiencing stress, appearing to recover, then experiencing stress again, with each cycle potentially exhausting its resilience.

The low covariance environment of the last couple of years allowed gross leverage to rise to very high levels, as evidenced by prime brokerage data showing near-record positioning. When correlations are stable, risk models give the green light to add exposure – and funds did exactly that. Normally, to see a covariance shock, there is a monetary (rate hikes), fiscal (tariffs), or credit event. Usually, these are temporary. This one, in my opinion, as I have written, is different. This all fits with Elon Musk’s description of AI as a “supersonic tsunami.” AI speed, deflationary pressure and its reality is still doubted by most and positioning around the globe is still in massively in growth and companies built on code which is now free and ubiquitous.

A force moving this fast (supersonic) and this powerful (tsunami) doesn’t just disrupt one sector; it reshapes the entire landscape of winners and losers simultaneously, creating exactly the kind of cross-asset correlation shocks that destabilize risk models. As of now, it has been isolated to stocks, but given the sustained covariance shocks, it is always important to see if there is deleveraging contagion, and there are now small signs. Credit has slowly been bleeding over the last couple of weeks, adding another crack in the foundation. With constant turbulence signals, a structural force like AI reordering the economy and creating uncertainty on long-duration assets, leverage at elevated levels, and crowded positioning across the industry, I expect the market to remain volatile all year. Be nimble and get ready for a year where every month feels like a year.
Source: 22V Research

What is the Turbulence Model

The turbulence model itself is built to detect instability in the covariance matrix that underpins modern portfolio risk management. Hedge funds depend on stable correlations between assets to calculate position sizes, determine leverage ratios, and ensure that diversification actually provides protection. When these correlations are stable, leverage appears “safe” and hedges work as intended. The turbulence score measures when this stability breaks down, when assets that normally move independently start moving together in unusual ways, invalidating the assumptions baked into risk models and leading to increased portfolio volatility. The green bars on the chart represent the most dangerous phase: the period when the covariance matrix is destabilizing but market prices haven’t reflected it yet (SPX still rising, VIX still low). This is the window before forced deleveraging begins – when risk models are flashing internal warnings but the selling cascade hasn’t started. The fact that 2026 has produced as many green bars in six weeks as the prior two years combined suggests the covariance matrix is repeatedly destabilizing, risk models across the industry are getting hammered with warnings, and each “recovery” is burning through the system’s resilience, exactly the pattern that precedes correlation-driven meltdowns.


DISCLOSURES AND DISCLAIMERS

Analyst Certification

The analyst, 22V Research Group, primarily responsible for the preparation of this research report attests to the following: (1) that the views and opinions rendered in this research report reflect his or her personal views about the subject companies or issuers; and (2) that no part of the research analyst’s compensation was, is, or will be directly related to the specific recommendations or views in this research report.

Analyst Certifications and Independence of Research.

Each of the 22V Research analysts whose names appear on the front page of this report hereby certify that all the views expressed in this Report accurately reflect our personal views about any and all of the subject securities or issuers and that no part of our compensation was, is, or will be, directly or indirectly, related to the specific recommendations or views of in this Report.

22V Research (the “Company”) is an independent research provider. The Company is not a member of the FINRA or the SIPC and is not a registered broker dealer or investment adviser. 22V Research has no other regulated or unregulated business activities which conflict with its provision of independent research.

22V Research, LLC is a professional services and independent publication organization. 22V Research, LLC is not a securities broker-dealer, not a member of the Financial Industry Regulatory Authority (FINRA), not a registered investment advisor (RIA) and not a member of SIPC.

Securities transactions, when offered, are offered by 22V Securities, LLC through LPS Capital, LLC. Certain employees of 22V Securities, LLC are dually registered as securities representatives of LPS Capital, LLC or Analyst Hub Securities, LLC. 22V Securities, LPS Capital and Analyst Hub Securities are members FINRA, SIPC.

https://brokercheck.finra.org/

Current Ratings Definition.

SECTOR OUTPERFORM: An “outperform” rating anticipates the company will outperform the S&P Regional Banking Index (peer group).

SECTOR PERFORM: A “market perform” rating anticipates the company will perform in line with the S&P Regional Banking Index (peer group).

SECTOR UNDERPERFORM: An “underperform” rating anticipates the company will underperform the S&P Regional Banking Index (peer group).

Limitation Of Research And Information.

This Report has been prepared for distribution to only qualified institutional or professional clients of 22V Research Group. The contents of this Report represent the views, opinions, and analyses of its authors. The information contained herein does not constitute financial, legal, tax or any other advice. All third-party data presented herein were obtained from publicly available sources which are believed to be reliable; however, the Company makes no warranty, express or implied, concerning the accuracy or completeness of such information. In no event shall the Company be responsible or liable for the correctness of, or update to, any such material or for any damage or lost opportunities resulting from use of this data. Nothing contained in this Report or any distribution by the Company should be construed as any offer to sell, or any solicitation of an offer to buy, any security or investment. Any research or other material received should not be construed as individualized investment advice. Investment decisions should be made as part of an overall portfolio strategy and you should consult with a professional financial advisor, legal and tax advisor prior to making any investment decision. 22V Research Group shall not be liable for any direct or indirect, incidental or consequential loss or damage (including loss of profits, revenue or goodwill) arising from any investment decisions based on information or research obtained from 22V Research Group.

Reproduction And Distribution Strictly Prohibited.

No user of this Report may reproduce, modify, copy, distribute, sell, resell, transmit, transfer, license, assign or publish the Report itself or any information contained therein. Notwithstanding the foregoing, clients with access to working models are permitted to alter or modify the information contained therein, provided that it is solely for such client’s own use. This Report is not intended to be available or distributed for any purpose that would be deemed unlawful or otherwise prohibited by any local, state, national or international laws or regulations or would otherwise subject the Company to registration or regulation of any kind within such jurisdiction.

Copyrights, Trademarks, Intellectual Property.

22V Research Group, and any logos or marks included in this Report are proprietary materials. The use of such terms and logos and marks without the express written consent of 22V Research Group is strictly prohibited. The copyright in the pages or in the screens of the Report, and in the information and material therein, is proprietary material owned by 22V Research Group unless otherwise indicated. The unauthorized use of any material on this Report may violate numerous statutes, regulations and laws, including, but not limited to, copyright, trademark, trade secret or patent laws.