

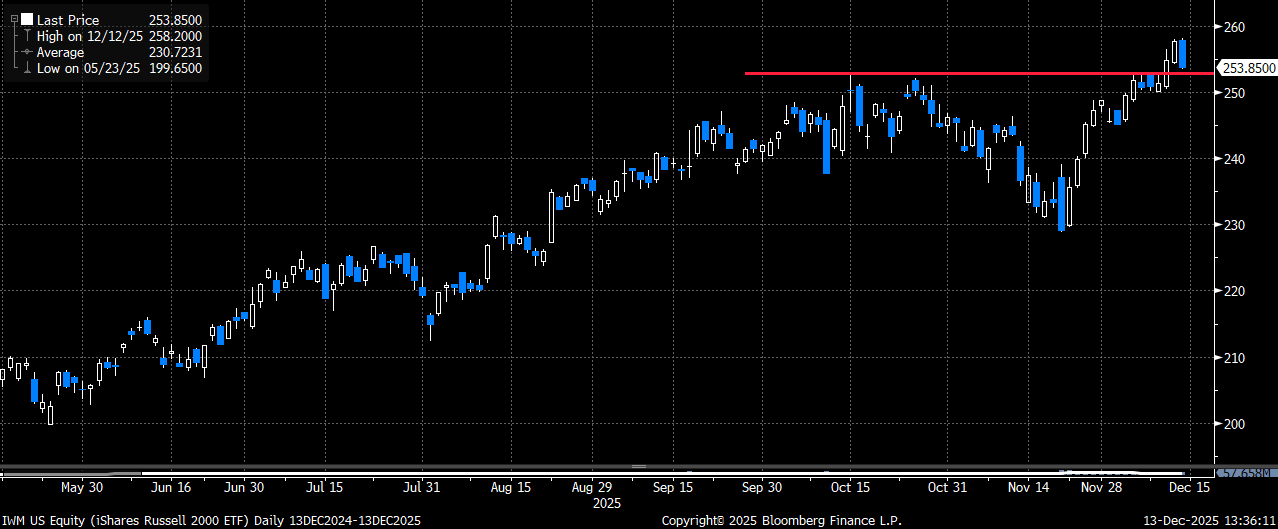
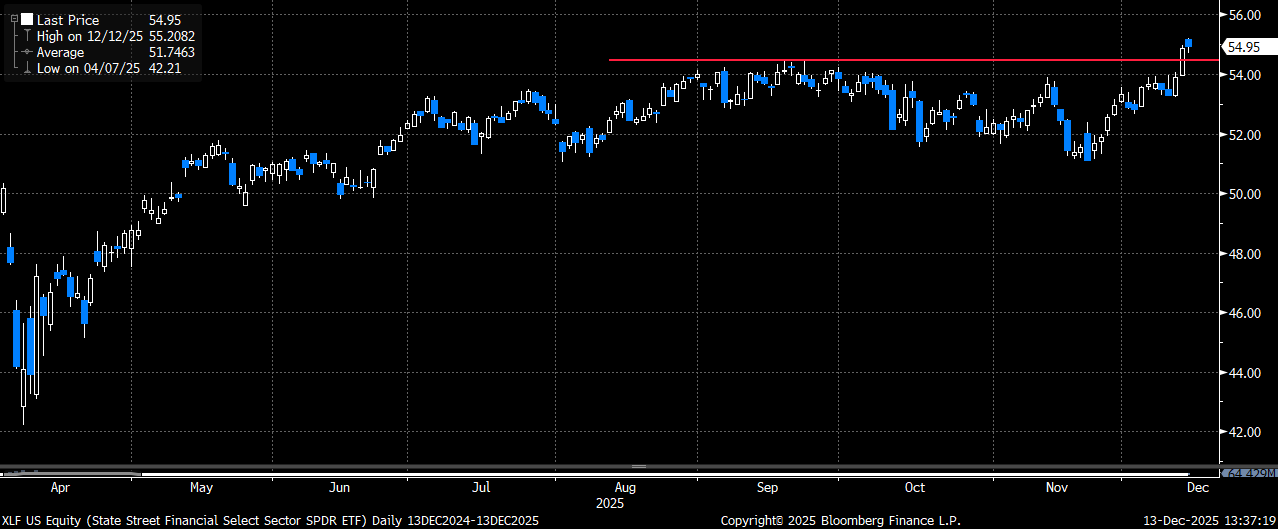
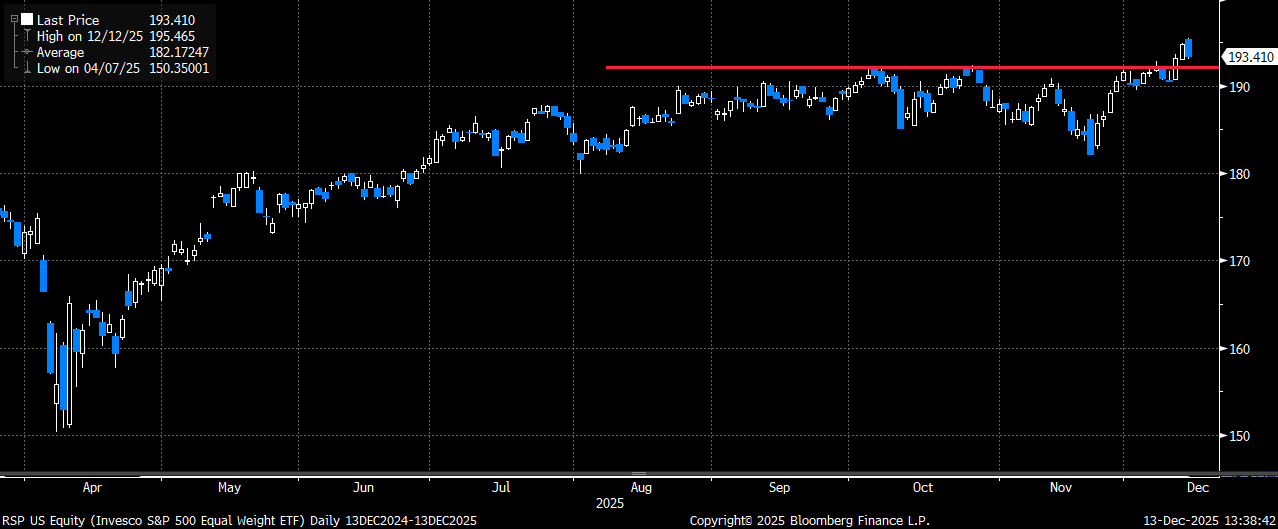
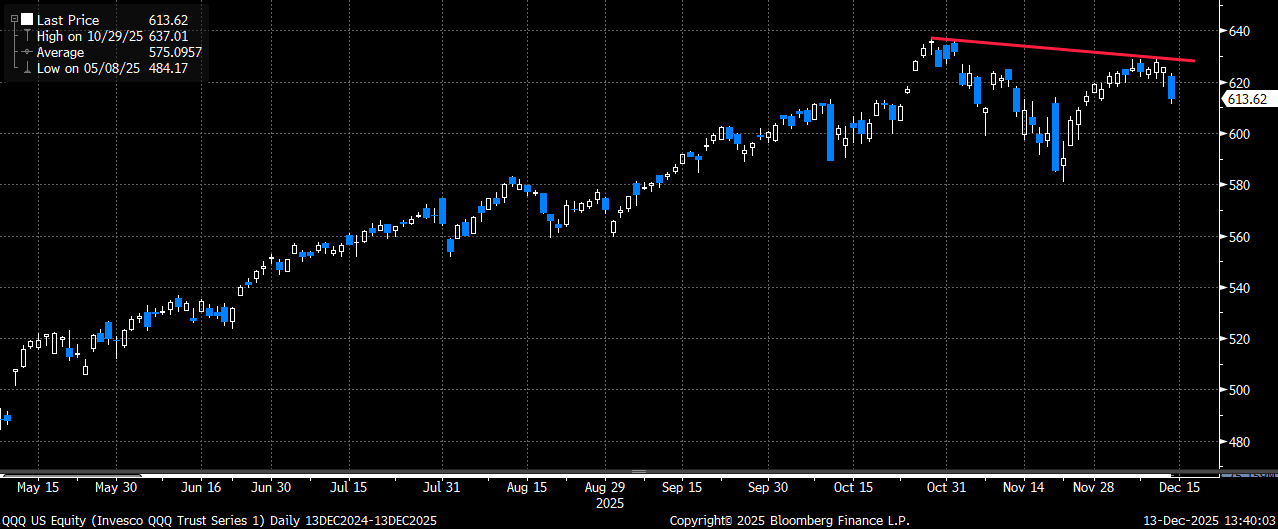
Last week was another interesting one for the markets as we got the expected rate cut and a more dovish tone out of the Fed and Chairman Powell. With that backdrop, we saw many areas of the market breakout to new highs (most notably on Thursday), before pulling back a bit on Friday to close the week. Among the sectors that saw a move to new all-time highs last week were the small caps (IWM), large-cap financials (XLF), industrials (XLI) and the equal-weighted S&P (RSP). The notable laggard was the tech-heavy Nasdaq (QQQ) which was brought down by poor reactions to earnings from both Oracle (ORCL) and Broadcom (AVGO). This continues a theme we have seen since late October, early November, when tech stopped outperforming the overall market. In fact, QQQ not only was unable to make a new high on the market rally back off the November lows, but the highs made on Wednesday as the Fed announcement and press conference was taking place were still ~ 2% below those October highs.
Small caps (IWM) with a breakout to new all-time highs this past week
Large cap financials (XLF) also with a decided breakout after months of trading sideways
The S&P equal-weight (RSP) with a similar-type breakout
The tech-heavy Nasdaq (QQQ) was the clear laggard and came nowhere close to the October highs on the last market rally as the AI trade continues to come under pressure
As the “crowded” tech/AI trade continues to come under pressure, it appears that much of the money coming out of that trade is being redeployed to other areas of the equity market (as witnessed by the technical breakouts we saw from several parts of the market). With the bullish backdrop of an easing Fed, a strong economy, and no real signs of higher inflation (yet) it certainly seems possible that we can continue to see those non-tech parts of the market do well (especially if we continue to see money come out of the largest companies). While most of the sectors I mentioned above should continue to do well in this environment, I wanted to highlight the equal weight (RSP) as my “preferred” way to play for a more broadening out equity rally (via options). RSP is very similar to the small-cap (IWM) trade as they both have a roughly 13% weighting in tech (QQQ has a 54% weight and SPY has a 33% weight). By minimizing the tech weighting, while overweighting the other parts of the market that are now leading (banks, industrials, consumer discretionary), these are likely to continue to outperform (assuming tech continues to act as a drag on performance).
If both RSP and IWM are expected to continue to “work” and outperform then why do I prefer RSP calls? There are several reasons why I believe RSP could be the “better” choice if considering adding limited-risk upside trades:
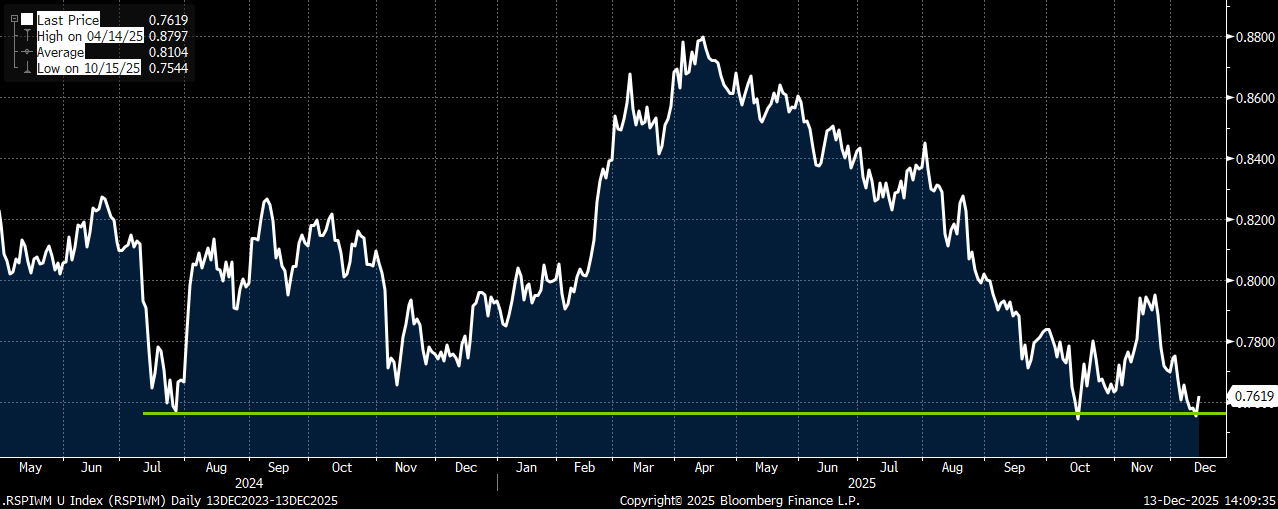
1. The RSP/IWM relative spread is back at the October lows and just below where the spread bottomed in July 2024
We have already seen a sharp outperformance by the small caps since April (when the market bottom on the tariff selloff). There is also still a decent percent weighting in some of the more speculative (profitless) companies in the Russell (IWM). These names could act as a “drag” to performance if we continue to see the tech/AI trade really start to unwind. We saw a glimpse of this on Friday with IWM down 1.53%, or almost a full percent more than the equal-weight index. What also caught my eye was that on the “everything” rally on Wednesday we saw RSP and IWM essentially move the same 1.4% higher. We typically have been seeing IWM outperform on those types of days, so the fact that RSP held its own on a big up day was very encouraging to see.
The RSP/IWM relative spread is back at the October lows, and just about where it also bottomed in July of 2024
2. RSP upside call implied volatility looks CHEAP to IWM call implied volatility
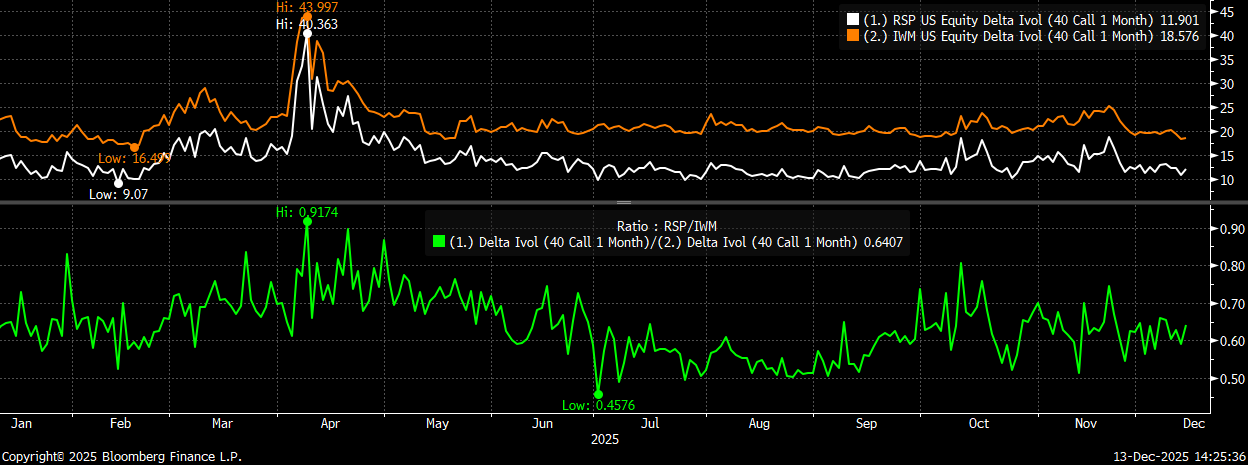
Looking at the 1-month (Jan) vols for both, RSP 40-delta call vol trades ~ 12 vs 19 for the same delta IWM calls in Jan. While not at the lows, it is definitely at the lower-end of the relative range. Put another way, IWM would have to outperform RSP to the upside to a 1.6x beta (or more) to justify buying IWM calls here (with the relative spread already at the highs (IWM to RSP). For context, IWM has traded to a 1.22x beta vs RSP over the past year (and with an 83% correlation). By buying RSP calls (over IWM calls) you can either spend less, or get more long notional exposure for the same spend (roughly 60-65% more).
RSP 1-month 40-delta calls trade at an implied vol ~ 12 vs a roughly 19 vol for the same delta IWM calls
3. RSP not only had a breakout to new highs, but both the RSP/SPY and RSP/QQQ relative spreads have moved up above their April downtrends
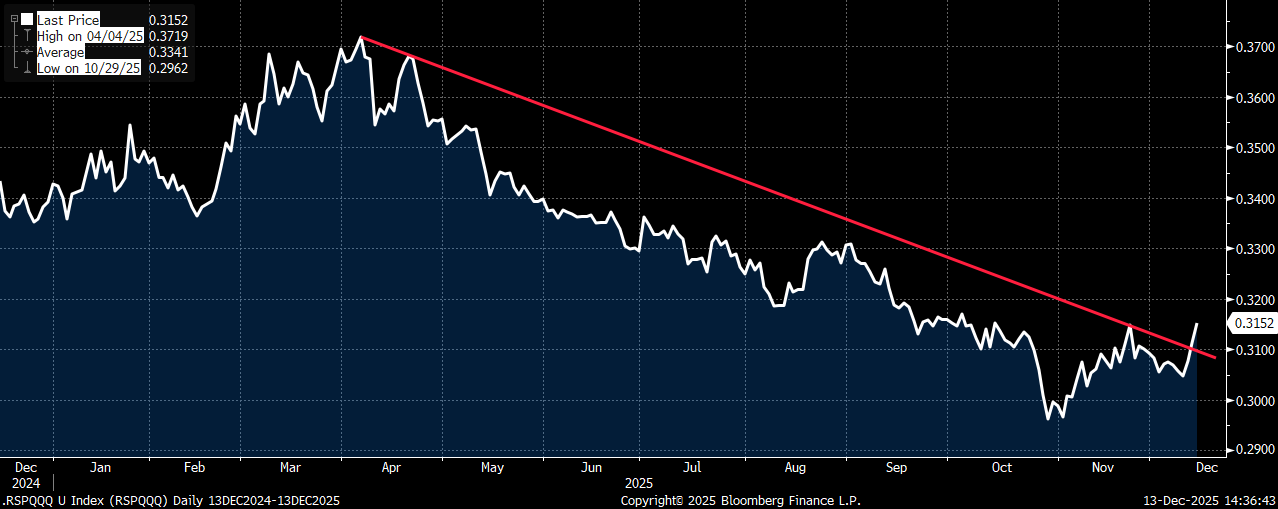
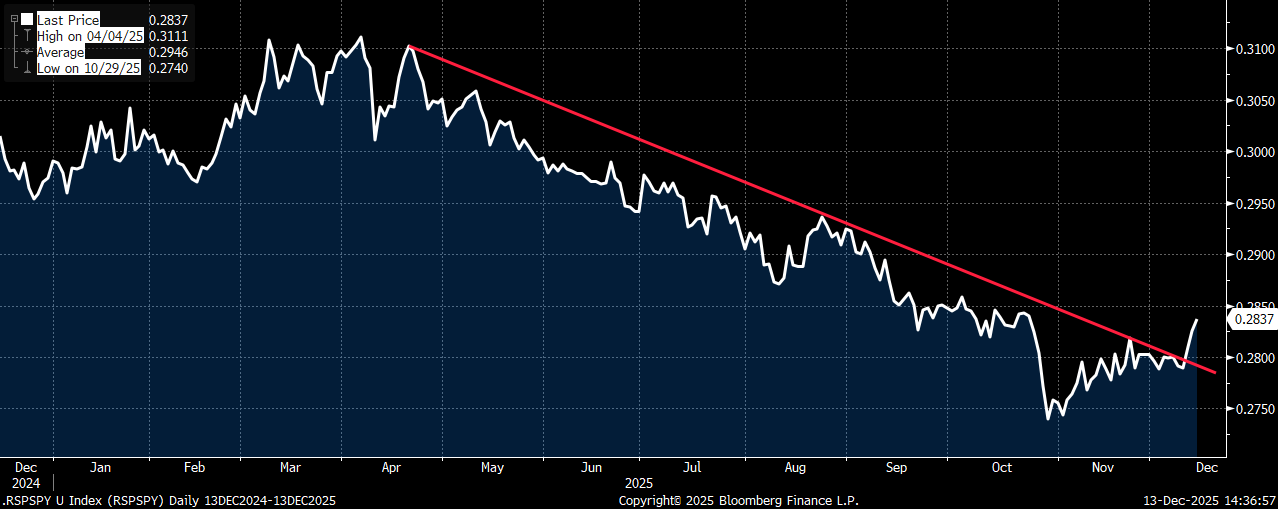
As I mentioned above, RSP had a clear breakout last week above the former highs from October. What I also have noticed is that both the RSP/SPY and RSP/QQQ relative spreads have also broken above their April downtrends. Perhaps even more significant is that these spreads are moving back higher AS the RSP is going up as well. We typically would see this spread move higher on a market decline (led by tech). The fact that these spreads are turning positive while RSP is just below the highs speaks to the strength we are seeing in the non-tech area parts of the market (further supporting the upside call purchase in my opinion).
RSP/QQQ relative spread has broken above the April downtrend
The RSP/SPY relative spread also with a similar breakout above the April downtrend
Trade I suggest:
Buy RSP Jan 196 calls for ~ $1.70 (RSP 193.41 Fri close ref)
Trade Details:
- Buying the Jan 35-delta calls that are less than 2% out of the money (even after the expected .84 div on 12/22)
- Fits with the 22V theme of a broadening-out rally as we move into ‘26
- RSP should trade like IWM, but given relative underperformance and cheaper vol I believe it’s the “better” vehicle at this time to add limited-risk upside exposure
- Please contact me or the 22V sales team for updated pricing and execution capabilities

