

One aspect of the current debate around monetary policy that seems striking to me is the widely accepted claim that it is obvious that the labor market has “continued to weaken” in recent months. We got a clear whiff of that in Fed Governor Waller’s comments to Fox Business this morning, which I covered briefly in a note earlier today. And the idea circulates widely.
But is it true? On the data, the 3-month rate of change of private employment bottomed in August and recovered nicely in September. What that rate of change is in absolute terms is a function of how much we expect the current data to be revised down. Waller asserted that the recent QCEW data imply that September employment growth might be revised down by 50 – 60k a month, with most of that presumably concentrated in the private-sector count. I don’t think it is unreasonable for Waller to extrapolate from QCEW data referring to an earlier period. But unless the revisions are greater to September than to earlier months, that would not overturn the idea that employment growth had bottomed, at least temporarily. And it is not obvious that such a downward revision, even if delivered, would necessarily imply that recent employment growth has been below the breakeven. After all, direct estimates of the breakeven rate suggest that it might easily be as low as zero. And the employment / population ratio has been edging up in recent months. The move in the epop is not dispositive. But that is the point. We don’t know. It is a near call.
I cannot prove the point, but I suspect that a key premise among those who view labor market weakening as obvious is the idea that the unemployment rate is a better measure of employment growth relative to “potential” than is the employment / population ratio. Such people – understandably – are impressed by the 12 basis point rise of the unemployment rate during September, even though it was more than fully explained by a rise of the labor force participation rate. (As mentioned, the employment / population ratio has been edging up, although that could easily be noise.)
Before Sahm
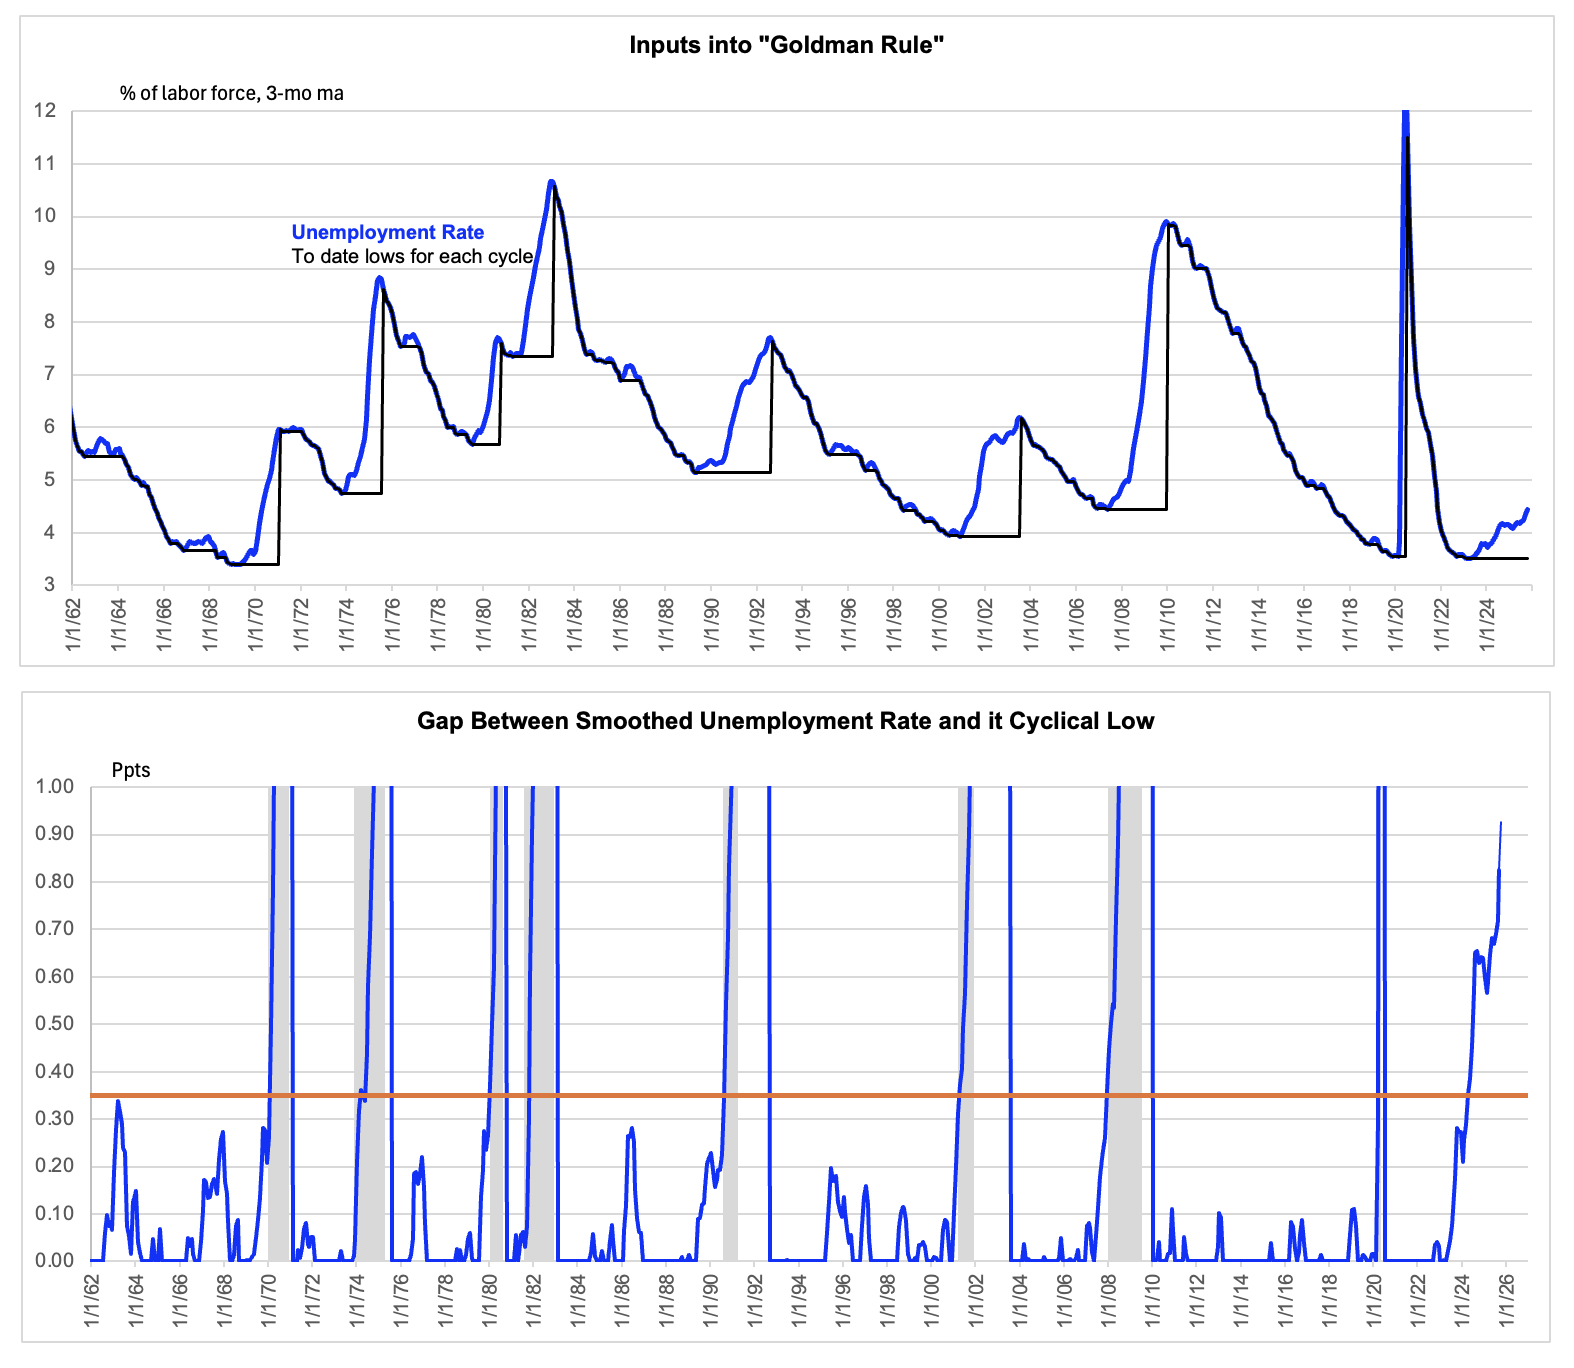
Data depicted as thick line are actual to September. The last tick, as the thin segment, presumes replaces the 3-month moving average for September with the September value itself, penciled in as the October observation. Not that it matters. The rule got triggered long ago.
I wonder if those demand bears (or doves) might be conflating the unemployment rate as a consistency check on whether employment growth is running above or below the breakeven (or equivalently its potential rate) with the unemployment rate as a recession indicator. Historically, any rise of the 3-month moving average of the unemployment rate above its own cycle low of more than 35 basis points has been associated with recession. I call this the “Goldman Rule,” taking some liberty, because I first learned of it from Bill Dudley. The chart above shows a picture of this idea, although I should mention that all the data are current vintage, as opposed to contemporary vintage.
What I call the Goldman Rule has recently been displaced by the so-called Sahm Rule, which has as its trigger the one-year low of the smoothed unemployment rate, rather than the absolute flow for the cycle. It is often said that the Sahm Rule has caught every recession in the postwar era. But that is false. The rule caught the Covid shock, which was dead obvious, and then gave a false positive last summer. Prior to that it neither succeeded nor failed for the simple reason that it did not exist.
The Sahm Rule is not currently generating a recession signal. And it would not do so even if the unemployment rate were to have risen another 13 bps in October and then were to hold there indefinitely. (Combinations that are steeper than that or more extended would trigger the rule.) In my view, the contradiction between the signal from the “Goldman Rule” and the Sahm Rule reflects one or both of two considerations. First, none of these retrofit rules could possibly be robust. It is virtually inevitable that minor differences in specification would generate conflicting signals. This issue is not specific to the use of the unemployment rate as a recession indicator. It is a feature of all data mining exercises, as I emphasized in real time during the recession scare just over a year ago.
Second, and going slightly in the opposite direction, it is probably arguable that a slow rise of the unemployment rate is less likely to be self-reinforcing via confidence effects than a gradual rise of the unemployment rate, especially if monetary policy is reacting to that. In other words, one might argue that the Sahm Rule makes more sense. It is just that this is not testable in the usual way, because of the data mining issue mentioned above.
So, where does this leave us net net? I would say that there is a high-conviction take and then a lower-conviction one. My high-conviction take is that the higher unemployment rate does incline the Fed to raise the speed limit on demand growth, even if the rise of the unemployment rate reflects a higher participation rate, rather than a falling employment / population ratio. Another way to put this is that, at the Fed, the unemployment rate is a more important measure of “tightness” than is the labor force participation rate. This may seem like an obvious point, but if we were to rewind the clock even a decade, we might find that the consensus was the opposite, that the employment / population ratio dynamics were more important. And separately, there may be some Goldman-Sahm rule reasoning at the Fed. They may fear the forward looking implications, operating through confidence, of the higher unemployment rate.
The lower-conviction take, which remains my base case, is that the labor market data recently have come as a minor relief – as opposed to a source of additional worry – around the sustainability of the expansion itself. I will stick with the view that the signal here has been one of Fed friendliness, not weakness.

