As the third quarter comes to an end, it’s once again time to start turning our attention to earnings season. As I mentioned in my note last week, this remains a market where you want to own vol, on both a single-name and sector/index basis. The low VIX reading has also meant that sector volatility is also depressed. Therefore, I wanted to highlight a few sectors that have started to lag the overall market, and where “cheap” sector hedges that also cover earnings should be considered. In most cases not only is volatility cheap, but the sector/etf vol trades at a substantial discount to the top-weighted constituents implied volatility.
Large-Cap Biotech (IBB) November put spreads look attractive as the healthcare trade is under pressure once again
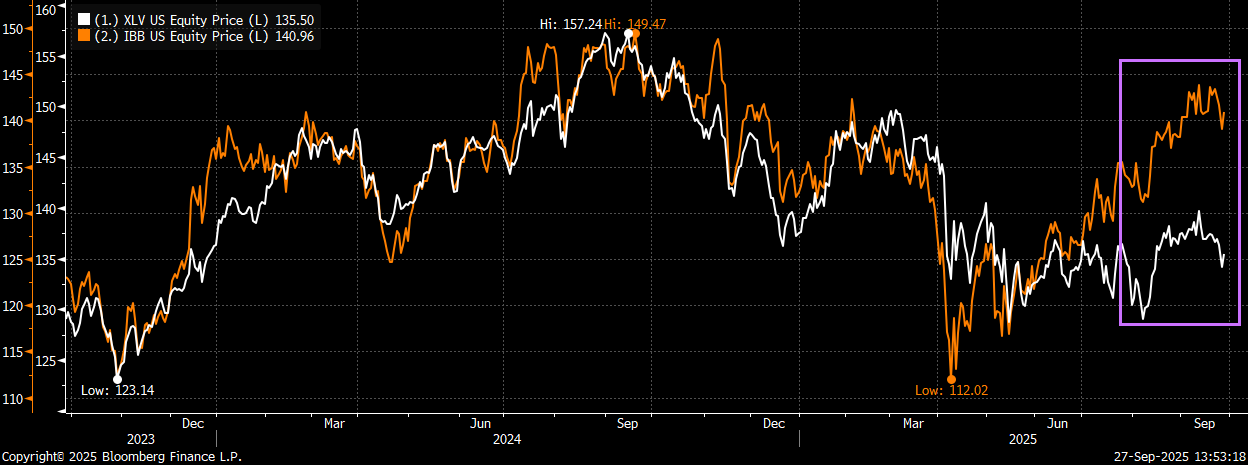
The main large-cap biotech etf (IBB) looks like it could be in jeopardy of breaking below the April uptrend support after the 34% rally off the lows. Also, of concern for the sector is that the main pharma etf (XLV) has already broken below recent support, and given the past relationship between XLV and IBB, it appears that we could see a “catch-up” trade in IBB (to the downside). What I also like about owning tactical hedges in IBB is that 2-month (November) 40-delta put vol is back near the lows, even though November options should capture the bulk of the earnings for the sector.
IBB rallied 34%+ off the April lows to the recent highs and now looks to be in danger of breaking below the uptrend support

Now seeing a wide divergence between IBB and the main pharma etf (XLV). Could be setting up for a “catch-up” trade lower for IBB
Trade:
Buy IBB November 21st 138/120 put spread for ~ $3 (IBB 140.96 Fri closing price stock ref)
Trade Details:
- Buying the November put spread following sharp rally off the April lows (to just below the clear resistance at the 150 area)
- Put spread starts ~ 2% below spot and offers a 5x to 1 max payout
- IBB 40-delta put vol back near the lows
- Weakness in the main healthcare etf (XLV) could be a harbinger for the large-cap biotech trade
- Nov structure will capture earnings for most of the largest weightings (GILD, AMGN, VRTX and REGN to name a few)
- Put spread can be used to hedge existing biotech/pharma long exposure, or as a limited-risk bearish bet (especially given how poorly most of healthcare acts)
- Please contact me or the 22V sales team for updated pricing and execution capabilities
Staples (XLP) remain weak and look like they could make new short-term lows
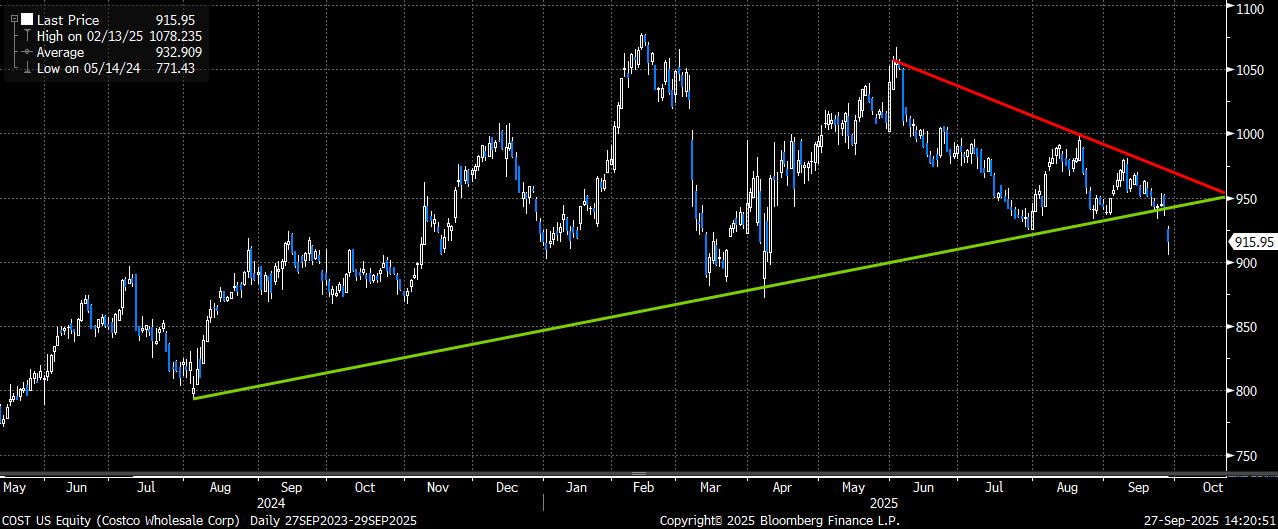
The main staples etf (XLP) broke below the recent support level ~ 79.5 last week and now appears to be in danger of at least testing the Jan-April lows ~ 76 (and possibly go even lower). While we have continued to see weak earnings from several of the more “traditional” names in the group (specifically the food and beverage and household product stocks), now even the retailers in XLP are starting to break lower (specifically the dollar stores and COST). I would argue that XLP performance would be way worse had it not been for these retailers holding it up. Costco (COST) reported “better” earnings on Thursday, yet the stock dropped by ~ 3% on Friday, in a decidedly up tape. Walmart (WMT) is the largest weighting in XLP at 10.6% and that too appears to be acting “toppy” as it rallied back from the post-earnings lows from August but remains below the Feb-Aug all-time highs. With the likes of COST, TGT, BJ and KR all moving lower, it seems unlikely that WMT (at 40x) is going to “save” the group/sector.
XLP gapped below recent support last week and now appears at risk of a move back to the Jan/April lows (or even the April ’24 lows)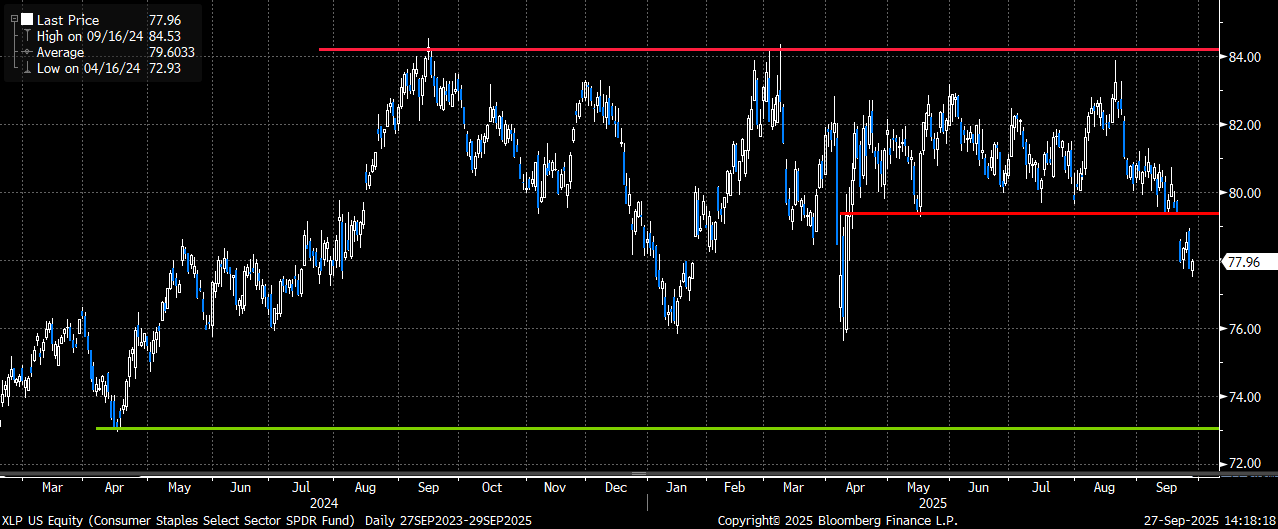
Costco (COST) with a break below longer-term support on earnings. Is WMT far behind? (WMT and COST are the 2 largest weights in XLP at ~ 20% combined)
Trade:
Buy XLP Nov 21st 77 puts 1x
Sell XLP Nov 21st 73 puts 2x
Costs ~ $0.40 (XLP 77.96 Fri closing price stock ref)
Trade Details:
- Buying the November 1×2 put spread in XLP following break below recent support last week
- Put spread starts just over 1% below spot, and is targeting a potential move back to the April 2024 lows ~ 73
- Trade offers a 9x to 1 max payoff, while capturing favorable put skew (why I like the 1×2 ratio trade)
- Nov expiry not only captures bulk of earnings for the sector, but WMT reports on 11/20 (day before the Nov options expire)
- Trade can be used to hedge long exposure to the staples, or as a limited-risk bearish bet
- Please contact me or the 22V sales team for updated pricing and execution capabilities
Airline stocks (JETS) could be in for some near-term turbulence
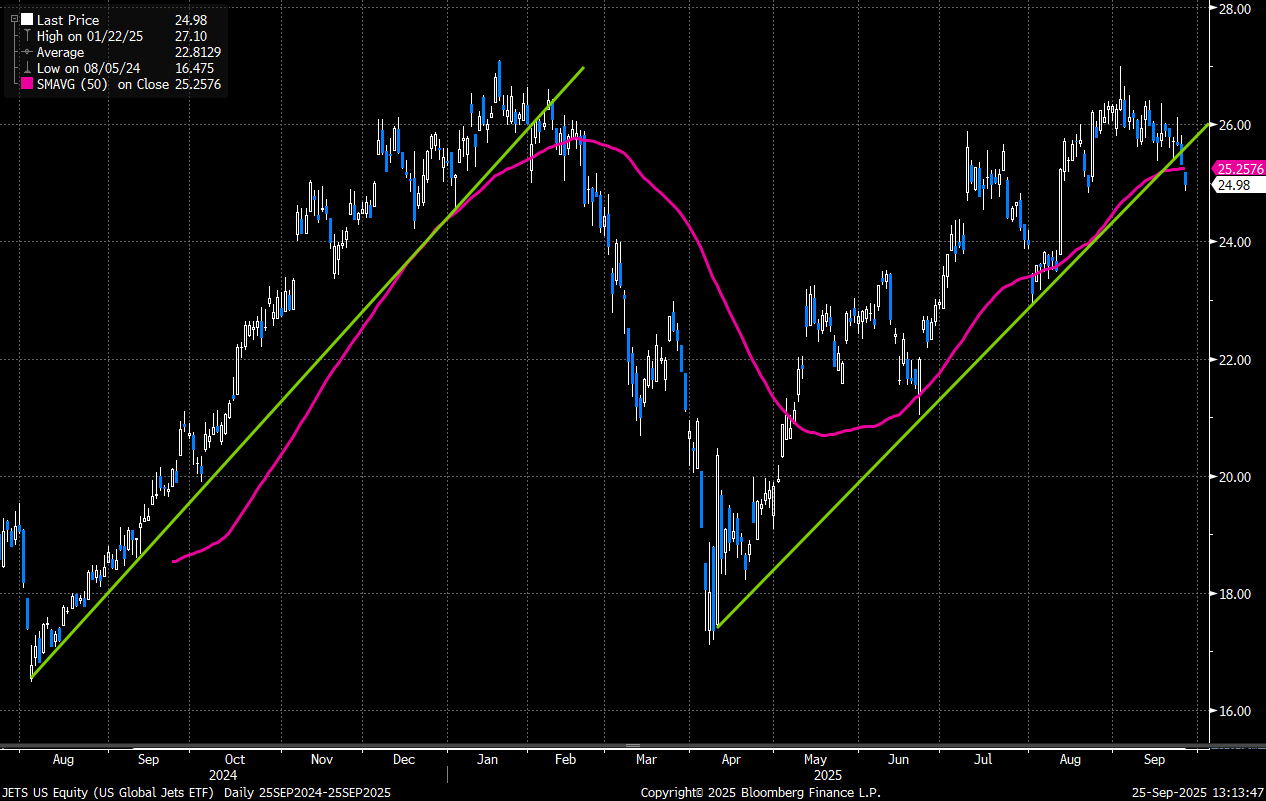
If the move in the airline sector (JETS) since the April lows seems familiar, it should. We had an almost identical rally in the group from the August 2024 lows to the January 2025 highs. After peaking in Jan, the etf declined by as much as 36% thru the April lows. While I am not saying we are due for that dramatic of a drop once again, I do think that given the volatile nature of the group that owning tactical hedges for the upcoming earnings season does seem to make a lot of sense (if long/overweight). What I especially like about owning JETS puts is that while JETS 1-month put vol remains near the recent lows, we have started to see a decided bid to vol in many of the top-weighted names to reflect the earnings risk.
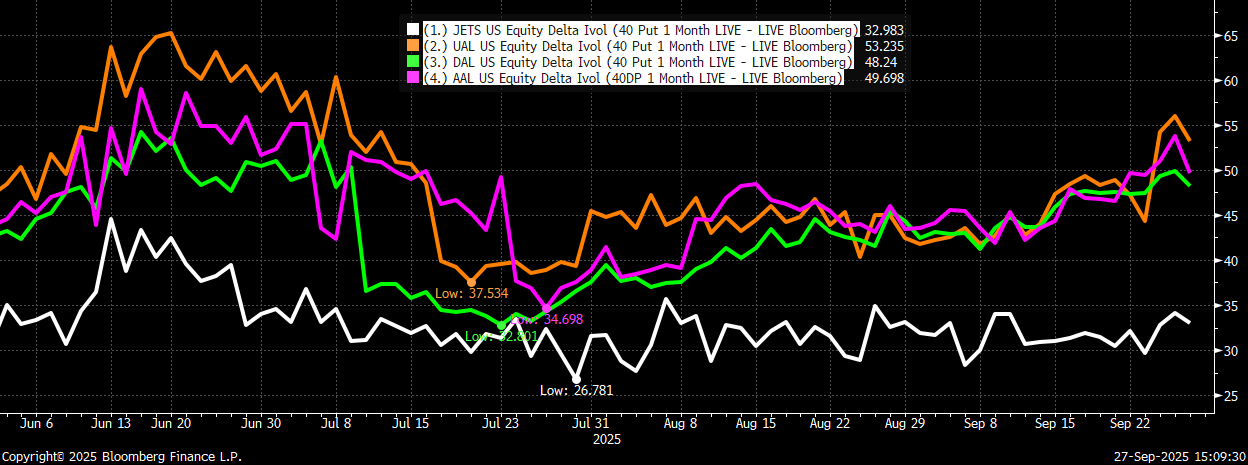
The top 4 names in JETS (UAL, DAL, LUV and AAL) are all due to report earnings by Oct 24th. These 4 names all carry a roughly 10% weighting in JETS and collectively they make up a nearly 42% weighting in the etf. Looking at the JETS Oct 24th 24.5 puts (39-delta) I see them trading at an implied vol ~ 33. This compares with a 48 vol for DAL puts, a 55 vol for UAL puts, a 43 vol for LUV puts and a 51 vol on the AAL puts (all same Oct 24th expiry). As you can see, JETS vol trades at a sharp discount to the 4 main names, even though you get a nearly 50% weighting in JETS in those names.
One other potential concern for the airline stocks could be the technical breakout we saw in oil last week. Oil prices had been relatively contained for the last several months. Should we see a continued bid in crude that could easily become a headwind for the group, especially after the 58% rally they enjoyed from the April lows to the September highs (before their recent decline).
The main airline etf (JETS) with a VERY similar move to the Aug-Jan rally. Will we be seeing another large decline from here?
Oil had a technical breakout to the upside last week after months of consolidation. This too could become a headwind for the sector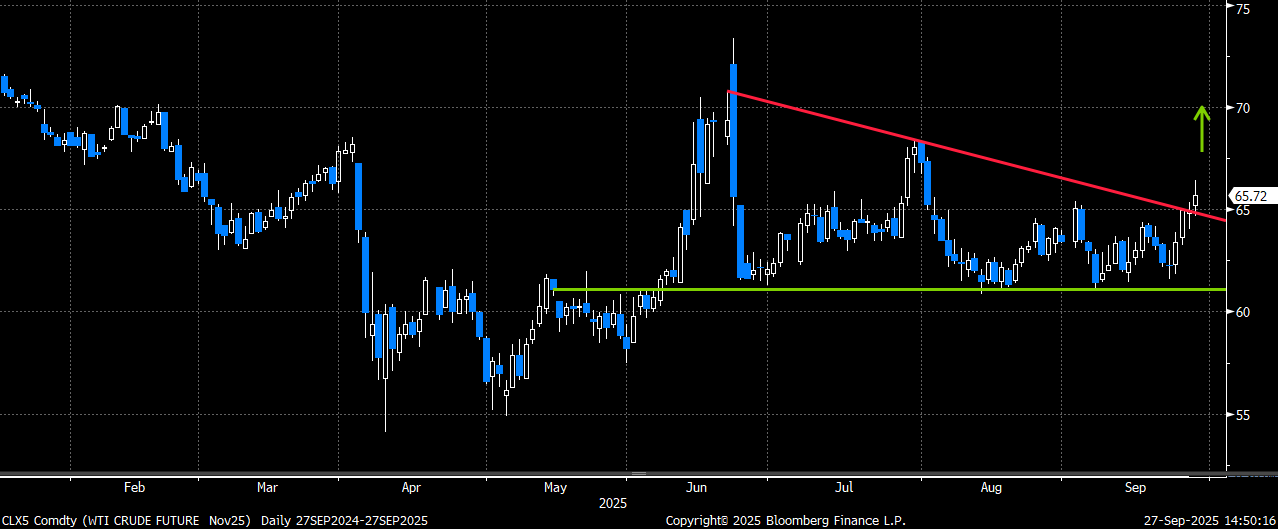
Trade:
Buy JETS Oct 24th 24.5 puts for ~ $0.70 – $0.72 (JETS 24.92 Fri closing price stock ref)
Trade Details:
- Buying the Oct 24th airline sector puts following break below the April uptrend support
- We saw a very similar move in the sector last year, and then a sharp decline following the break below support in Jan
- Oct 24th puts should capture earnings for the largest weighted names
- JETS 40-delta put vol is trading at a substantial discount to the individual names
- Rising oil prices could also turn into a possible headwind for the sector
- Puts start less than 2% below spot
- Puts can be used to hedge long exposure to the sector, or as a limited-risk bearish bet given attractive setup
- Please contact me or the 22V sales team for updated pricing and execution capabilities
JETS 1-month 40-delta put vol trading at a large discount to UAL/DAL and AAL 1-month 40-delta puts