

The CPI and PPI reports for July seem on balance to have been a minor relief. But the underlying inflation trend bottomed about a year ago, and current tariff “policy” implies that trailing 12-month core PCE inflation would probably rise to around 3½% by early next year. Increasingly, we see evidence that tariffs are being paid by Americans and there is tentative evidence too that domestic suppliers may be taking advantage of the additional pricing power created by tariffs.
The Fed would look past most of that inflation overshoot as transitory. However, with the labor market near full employment, and with potential GDP growth having been undermined by the abrupt deterioration of demographics, the Fed will have to target aggregate demand growth that looks quite depressed by historical standards to ensure that the inflation pulse is indeed transitory. This probably means aiming for real growth somewhere just north of 1% for the next few quarters and tolerating the above-average recession risk associated with that low target.
Actual demand growth appears also to be downshifting, as was highlighted quite dramatically by the weak employment figures two weeks ago. However, it is not at all clear that growth has slipped to a below-trend pace or is on the verge of doing so. This week’s July retail trade report in conjunction with the firm auto SAAR, for example, suggests that real PCE growth is on track to print at about 2% (ar) during the third quarter, although it is early days in the Q3 bean count.
One implication of this is that current forward pricing of the Fed might end up looking a bit aggressive if the August employment data do not confirm the weakness highlighted by the July data. Ignoring term premia, the market prices a terminal funds rate of just above 3%, which means they factor in a cycle-low below that figure. But for now, the higher conviction view relates to the growth prospect itself. Whatever the path of policy required to deliver the result, the Fed will be aiming for weak aggregate demand growth.
Single best measure at target in July
The air fares data in Friday’s import price index tilted the consensus estimate of the July Core PCE Price Index about 3 bps lower, and the informed guesser is now looking for a gain of 27 bps. About 8 bps of this expected gain can be directly attributed to portfolio management and advisory fees, which at high frequency are just an image of short-term swings of the stock market. And another 3 bps can be attributed to the fact that the lagging government measures of rent (or housing services) inflation is still running about 3 bps above marginal rent inflation, which is currently marginally depressed by historical standards. As a result, what I call the “single best” measure of underlying inflation in goods and services markets is on track to have been up just 16 bps in July, following 29 in June. So, July – taken in isolation – is running near the Fed’s target when expressed at an annualized pace. I assume this is lower than folks had penciled in, say, 10 days ago. (Please see the table at the end of this note for my final slicing and dicing of the consensus view ahead of the release on August 29.)
The broader context here remains troubling, though. The media made a big point of the July PPI being warm and tried to suggest that it was related to the tariff story. But the medical services price data there actually favored a reduction in the implied gain of the single best measure during July. And confirmation from the PPI that portfolio management and advisory fees would be an issue this month – for me – just underscored that point.
The PPI did hint at some so-called pipeline price pressures, but they do not seem to be all that jarring in context. About half the excess advance of the PPI was due vegetable prices, which would seem to relate more to immigration than tariff policy. And another large slice, which I am not quite able to quantify, was due to those financial services prices. The core finished goods PPI was up just 0.2 (SA) and the underlying trend there does not incline me to revise up my sense of how much damage is being done by the tariffs. In fairness, it looks like intermediaries within the production chain may have widened margins a bit during July, perhaps in response to greater pricing room provided by the tariffs, and that is not picked up in the chart below. But those figures tend to be volatile, which is why they are conventionally stripped out.
Domestic pipeline pressures lag upturn of core goods price inflation already realized
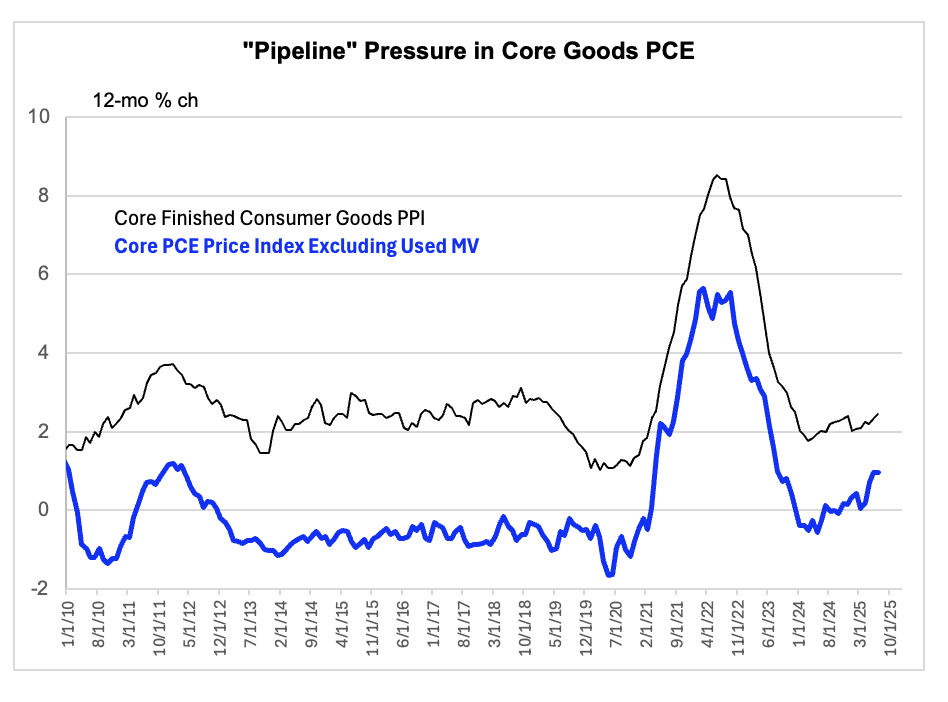
Source: Federal Reserve Bank of St. Louis (FRED), BEA, FH calculations and estimates
PPI data are actual to July. PCE price data are actual to June and estimated to July.
But the context is not great
In my view, there are three larger issues, which I present below in descending order of importance:
- July aside, core consumer inflation has turned higher and would seem to have further to run.
- Import prices confirm that the effective tariff hikes are being passed through.
- Inflation expectations seem to have stopped declining.
Let’s run through each of these quickly, with three charts and as few words as possible.
Goods and services inflation looks to have bottomed just over a year ago
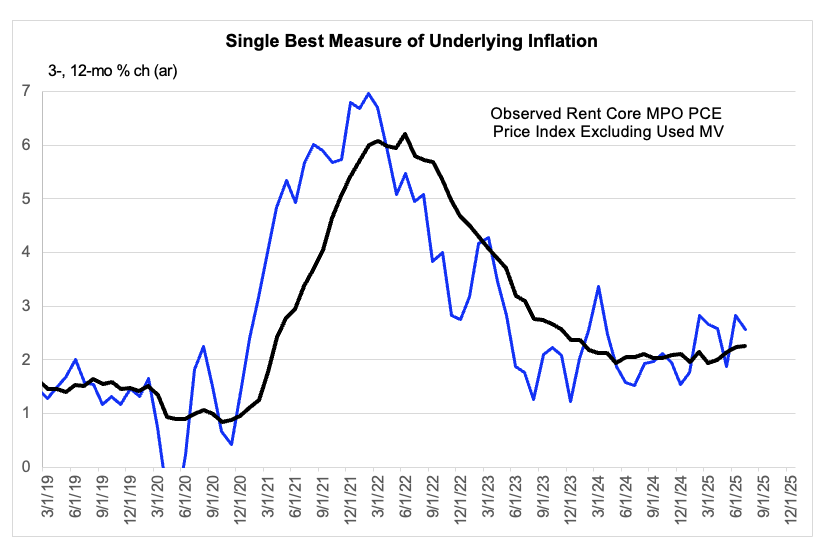
Data are actual to June and inference from informed consensus for July.
The single best measure of underlying goods and services price inflation bottomed in May 2024, more than a year ago. It is currently running at a pace that is about ½ a percentage point higher is consistent with the Fed’s inflation objective. The upturn so far has been shallow, and it has been entirely concentrated in goods price inflation, unsurprisingly. But only about 1/6 of the likely tariff passthrough is already in the data, and the pace of services inflation seem to be too high to be consistent with the Fed’s 2% target, even absent the tariff effect, because the ex-tariff trend in goods price inflation has probably hooked up in response to the end of globalization itself. For reasons I have been discussing, core inflation seems likely to hit about 3 ½ percent on a 12-month basis by early next year, although it should thereafter fade fairly quickly if the Fed limits demand growth in line with what I expect.
Another month of clarity about who’s paying
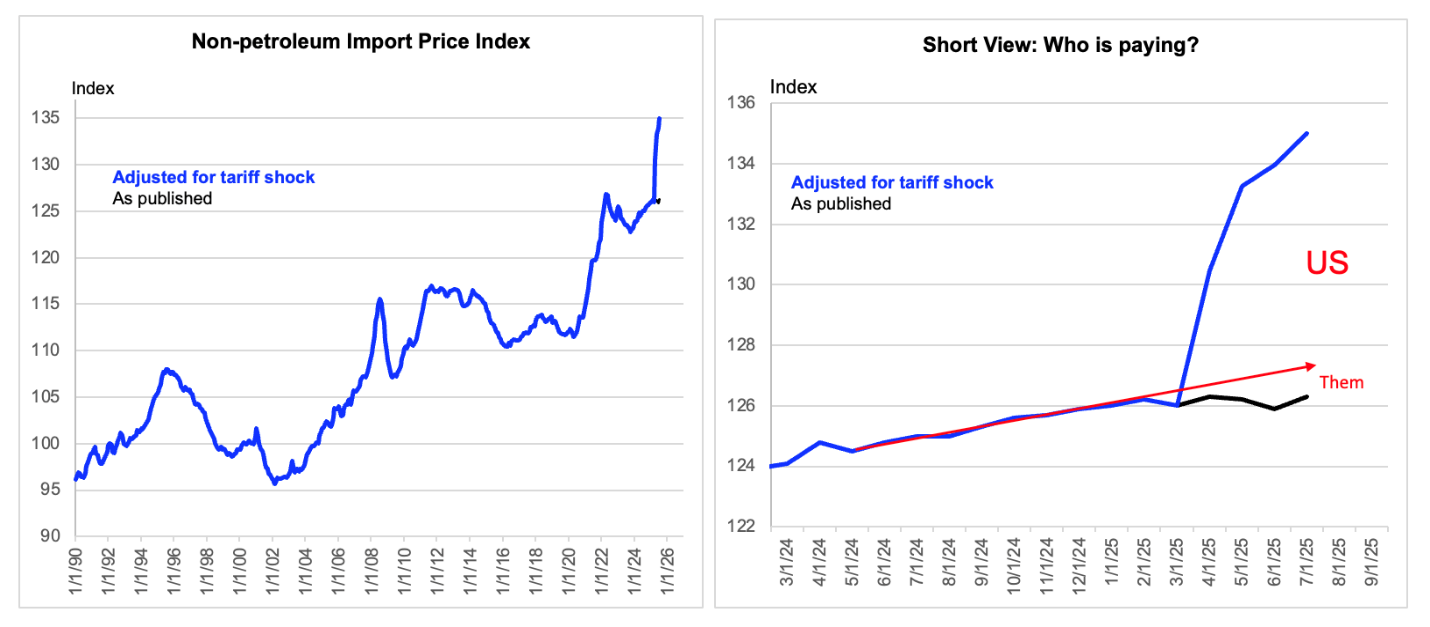
Import price data are actual to July. Tariff adjustments are estimated.
Published import prices are measured ex-tariff and the fact that they are not slowing is evidence that most of the tariffs are being paid by US importers, although passthrough to consumers has so far been limited — and might remain so (we need to admit that we don’t really know). In the chart above, I take some sell-side liberty with annotation. The trend line is meant to indicate what the published import price index might have done without the imposition of tariffs. The fact that measured import prices have not plunged is evidence that somebody in America is paying them.
More relevant NY Fed measure probably ticked back up in August
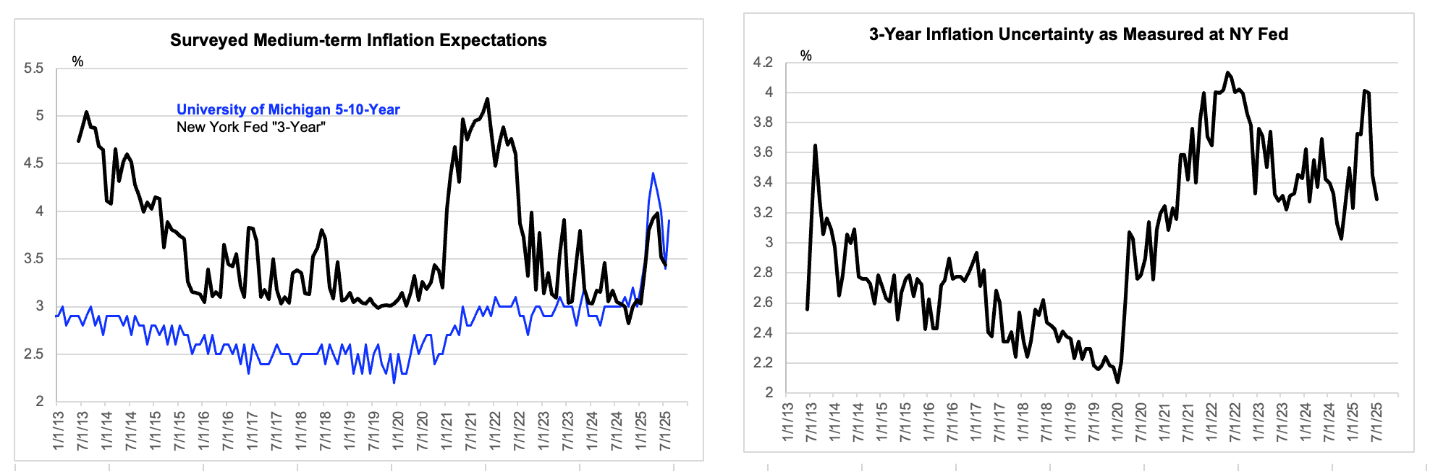
NY Fed data are actual to July. Michigan measure is actual to the August preliminary.
Chart shows the secondary NY Fed measure which is the result of a survey asking respondents for their single best guess of the inflation rate between 2 and 3 years from now, which is close to the most relevant horizon.
Finally, there was some evidence on Friday that inflation expectations have recently stopped falling. I do not attribute much relevance to the 5- to 10-year inflation expectation in the Michigan Survey because there is no link from that to actual inflation except to the extent that it pollutes inflation expectations at the 2- or 3-year horizon, for reasons I have been over in earlier notes. But the uptick there on Friday suggests that the measure I prefer is more likely to be about to tick up than down. The Fed likes to intone that inflation expectations are anchored. They do not really know that.
What we think we know is that the Fed is going to have to deliver very slow demand growth over the coming quarters to respect that weakness on the supply side and the need to ensure that the tariff-related inflation impulse is transitory, even if inflation expectations behave. And the risk, not my base case, is that they might not.
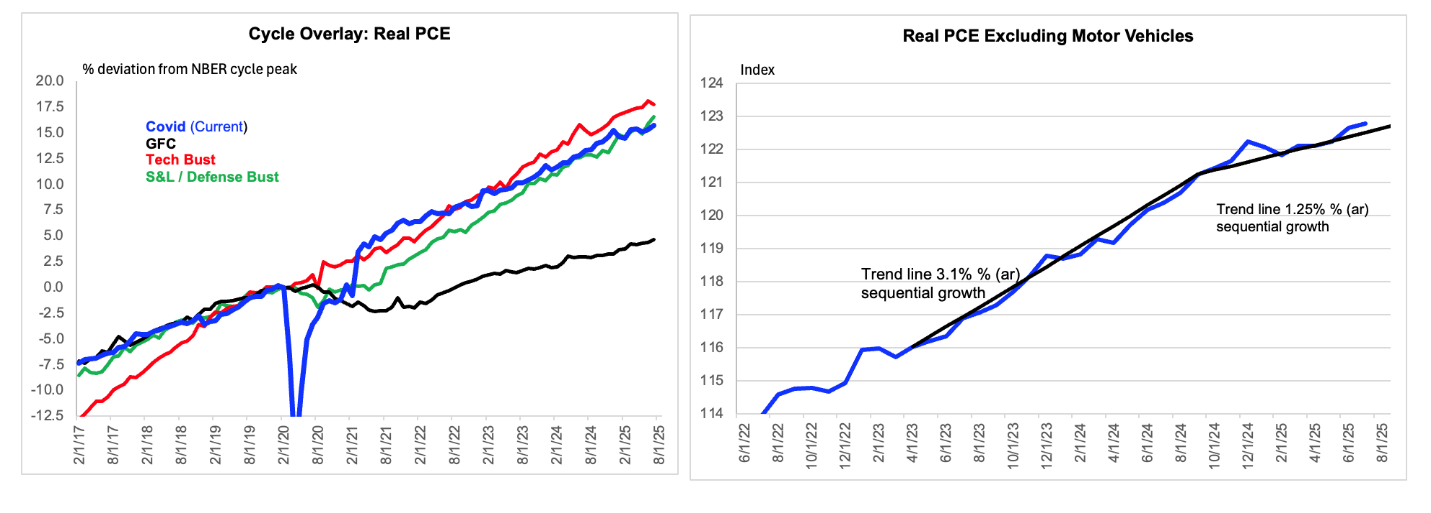
Slower trend real PCE growth rate seems to be holding
Data are actual to June and estimated to July
Aggregate demand growth has clearly cooled since the turn of the year. At 1 ½% (ar), core GDP growth during the first half of 2025 has been cut to less than half its pace during the second half of last year. And as mentioned at the top of this note, the employment data for July were unnerving, although mainly because of downward revisions to May and June that might reasonably be extrapolated into July as well. (We shall see.)
However, there is little evidence that the economy is currently faltering toward recession, and we have little reason to be confident that it will soon begin to do so, given that financial conditions currently look quite stimulative, and given further than fiscal policy seems (even with the direct drag from the tariffs) likely to be somewhere between neutral and somewhat stimulative next year, although Q4 could be a pothole.
The Lewis-Mertens Weekly Economic Index is probably not well suited to scaling the precise pace of GDP growth, although its authors design it to be expressed in that space. But it probably can be relied upon to pick up a sudden lurch, were one to develop, which does not currently seem to be the case. And last week’s retail trade report, including revisions, in conjunction with the firm auto SAAR for the month suggests that real PCE growth is on track to print at about 2% (ar) during Q2, even if sequential growth during August and September runs at the 1 ¼% trend growth rate implied by my eyeballing of the level of real PCE excluding autos, as indicated by the right panel of the chart below. Growth is weak, as we think we know it needs to be. But it is not obvious that it is so weak that we will need significant further help from the Fed.
Final inference from informed consensus for July
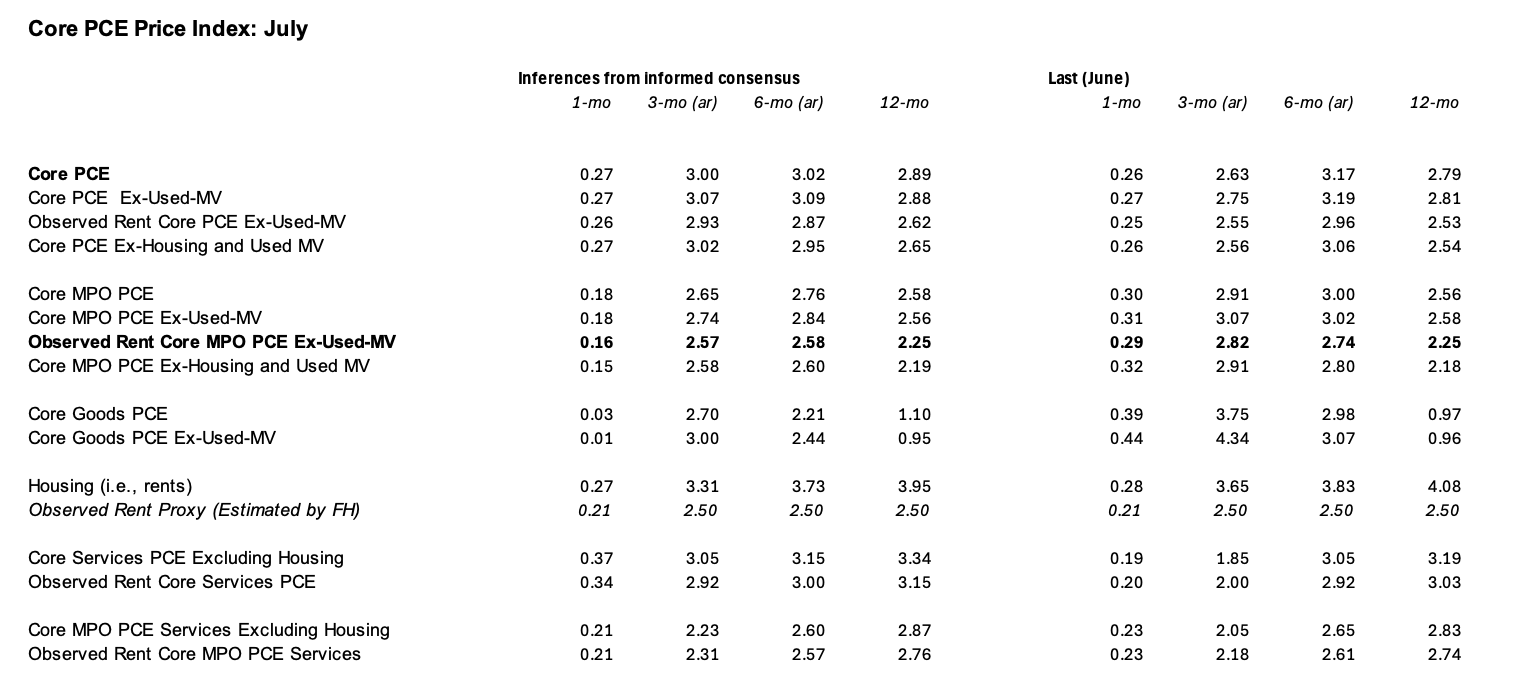
Data are actual to June and FH inferences from informed consensus for July.
[1] If the market sees an easing cycle, but is unsure of the date at which the low for the cycle will be realized, then the lowest future rate on the curve will overstate the expected low in rates for the cycle.

