Back Economics

Rise of effective tariff rate seems to have slowed

Published on August 13, 2025

Download the PDF Report

By

Gerard MacDonell

The Monthly Treasury Statement for July shows that US customs revenue rose from $27 billion in June to $28 billion last month.  We do not have an authoritative measure of what this means for the effective tariff rate, but a reasonable guess would be that the rate rose from 9% in June to about 9 ½% in July.[1]

This suggests that the 2-month rise of the effective tariff rate has slowed steeply during the past two months.  Between March and May, the effective tariff rate was up an estimated 5.6 percentage points. And between May and July it looks to have been up a slightly-less-tightly-estimated 1.3 percentage points.  I am not in a position to speak authoritatively on this issue.  Indeed, not even the experts seem to be. But this may partly explain why core goods price inflation was less of an issue in July than it was in June, as I mentioned in my note on the Core PCE bean count yesterday.

Somebody in America is paying the tariffs
A graph of a price

AI-generated content may be incorrect.
Source: Federal Reserve Bank of St. Louis (FRED), Treasury Department, FH calculations and inferences from trade analysts
Data are actual to June and estimated for July. 

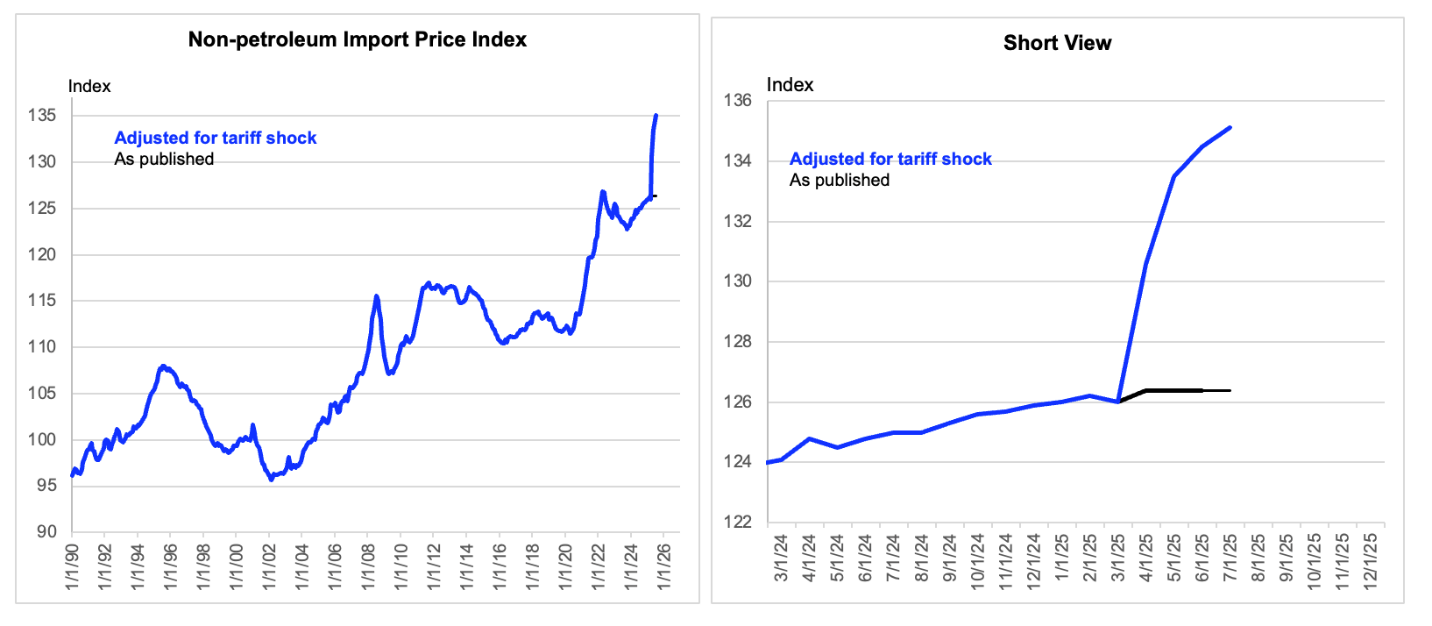
The chart above represents my attempt to quantify the impetus to imported goods prices paid by US importers, as opposed to received by exporters into the US.  Measured import prices, which are pre-tariff, were little changed between March and June. And for the purposes of this exercise, I boldly assume they were unchanged in July.  While the newly nominated head of the BLS may not understand this, the fact that import prices are roughly flat, means that Americans (firms or consumers) are effectively paying the tariffs.  Relatedly, I calculate that after-tariff import prices are up by about 7.2% since March. In the event of full passthrough to consumers, this would suggest that impetus to the Core Goods PCE deflator should be about 2.9%.[2]

In fact, the Core Goods PCE Price Index is up a cumulative 1.1% during the past four months, inclusive of the consensus estimate for July. So, this would imply a passthrough of 38% (false precision). I am aware that other analysts using a more granular analysis focused on specific tariff rates on specific goods come up with a smaller passthrough but my estimate captures effects on domestic prices as well, which may rise in sympathy with the prices of foreign produced goods.  Of course, this allows for a quirk, that the passthrough might be higher than 100%, which I realize is a weakness.

The Yale Budget Lab estimates that the effective tariff rate implied by current policy announcements is 18.6%, before adjusting for substitution towards lesser tariffed sources (which I think is the appropriate metric for assessing the price shock). This involves an increase of about 16 percentage points from the pre-shock baseline, 45% of which is already in import prices.  

If passthrough were to remain unchanged, and if the effective tariff rate were eventually to converge on what we take to be the rate implied by policy announcements, then we would have another 1.4 percentage point add to core goods prices, lifting the overall Core PCE Price Index by a further 35 basis points relative to baseline.  That is not a lot, and I would suggest that unless policy changes, the error around that simulation is not very wide.  

The more important debate is about passthrough.  Some analysts working up forecasts of passthrough at the granular level suggest it might triple the gain achieved thus far.  And if that tripling were to map to my broader measure of passthrough, then the cumulative add to the Core Goods PCE Price Index would be about 2 ½ times what we have seen so far.  That implies a rise of about 2 ¾ percentage points, which would lift the broader Core PCE Price Index by a further 70 basis points, relative to baseline. And if we take the baseline to be an inflation rate of 2 ¼% and assume this all happens by March next year, then this would take the 12-month core inflation rate to 3.2% by that month, followed by a quick fade if inflation expectations stay anchored, as is the base case. 

While this is playing out, the Fed will want to target a slight rise of the unemployment rate, via slightly below-potential aggregate demand growth, even as it looks most through most of the tariff impetus.  In other words, one does not need to assume that the Fed are inflation nutters to see that this points to the need for below-potential growth and the elevated recession risk (relative to base rate of 15% at one year horizon) associated with that.

But that is not the main point of this note.  Rather, the point is that the data we have seen thus far are consistent with, without being proof of, the standard prospective scoring of what the tariffs announcements would imply for inflation, subject to the important assumption that most of the passthrough remains in front of us.  

And that caveat is a legitimate point of weakness in the analysis because we don’t really know what passthrough will ultimately be.  Passthrough could be lower if importers eat the margin loss. Or, especially as I define it, it could be higher if there are larger effects on prices of domestically priced goods. 


[1] I had earlier been working with 10% for June. But my source there ended up being a bit out of consensus, and I now use 9%.

[2] In fairness to Antoni, I learned about this obscure technical issue only just over a month ago.  But I am not making huge pronouncements about how better to run the BLS or suggesting that flat import prices obviously prove that foreigners are paying the tariffs. Any decent economist knows that “I don’t know” is the right answer to most questions.  

DISCLOSURES AND DISCLAIMERS

Analyst Certification

The analyst, 22V Research Group, primarily responsible for the preparation of this research report attests to the following: (1) that the views and opinions rendered in this research report reflect his or her personal views about the subject companies or issuers; and (2) that no part of the research analyst’s compensation was, is, or will be directly related to the specific recommendations or views in this research report.

Analyst Certifications and Independence of Research.

Each of the 22V Research analysts whose names appear on the front page of this report hereby certify that all the views expressed in this Report accurately reflect our personal views about any and all of the subject securities or issuers and that no part of our compensation was, is, or will be, directly or indirectly, related to the specific recommendations or views of in this Report.

22V Research (the “Company”) is an independent research provider. The Company is not a member of the FINRA or the SIPC and is not a registered broker dealer or investment adviser. 22V Research has no other regulated or unregulated business activities which conflict with its provision of independent research.

22V Research, LLC is a professional services and independent publication organization. 22V Research, LLC is not a securities broker-dealer, not a member of the Financial Industry Regulatory Authority (FINRA), not a registered investment advisor (RIA) and not a member of SIPC.

Securities transactions, when offered, are offered by 22V Securities, LLC through LPS Capital, LLC. Certain employees of 22V Securities, LLC are dually registered as securities representatives of LPS Capital, LLC or Analyst Hub Securities, LLC. 22V Securities, LPS Capital and Analyst Hub Securities are members FINRA, SIPC.

https://brokercheck.finra.org/

Current Ratings Definition.

SECTOR OUTPERFORM: An “outperform” rating anticipates the company will outperform the S&P Regional Banking Index (peer group).

SECTOR PERFORM: A “market perform” rating anticipates the company will perform in line with the S&P Regional Banking Index (peer group).

SECTOR UNDERPERFORM: An “underperform” rating anticipates the company will underperform the S&P Regional Banking Index (peer group).

Limitation Of Research And Information.

This Report has been prepared for distribution to only qualified institutional or professional clients of 22V Research Group. The contents of this Report represent the views, opinions, and analyses of its authors. The information contained herein does not constitute financial, legal, tax or any other advice. All third-party data presented herein were obtained from publicly available sources which are believed to be reliable; however, the Company makes no warranty, express or implied, concerning the accuracy or completeness of such information. In no event shall the Company be responsible or liable for the correctness of, or update to, any such material or for any damage or lost opportunities resulting from use of this data. Nothing contained in this Report or any distribution by the Company should be construed as any offer to sell, or any solicitation of an offer to buy, any security or investment. Any research or other material received should not be construed as individualized investment advice. Investment decisions should be made as part of an overall portfolio strategy and you should consult with a professional financial advisor, legal and tax advisor prior to making any investment decision. 22V Research Group shall not be liable for any direct or indirect, incidental or consequential loss or damage (including loss of profits, revenue or goodwill) arising from any investment decisions based on information or research obtained from 22V Research Group.

Reproduction And Distribution Strictly Prohibited.

No user of this Report may reproduce, modify, copy, distribute, sell, resell, transmit, transfer, license, assign or publish the Report itself or any information contained therein. Notwithstanding the foregoing, clients with access to working models are permitted to alter or modify the information contained therein, provided that it is solely for such client’s own use. This Report is not intended to be available or distributed for any purpose that would be deemed unlawful or otherwise prohibited by any local, state, national or international laws or regulations or would otherwise subject the Company to registration or regulation of any kind within such jurisdiction.

Copyrights, Trademarks, Intellectual Property.

22V Research Group, and any logos or marks included in this Report are proprietary materials. The use of such terms and logos and marks without the express written consent of 22V Research Group is strictly prohibited. The copyright in the pages or in the screens of the Report, and in the information and material therein, is proprietary material owned by 22V Research Group unless otherwise indicated. The unauthorized use of any material on this Report may violate numerous statutes, regulations and laws, including, but not limited to, copyright, trademark, trade secret or patent laws.
